
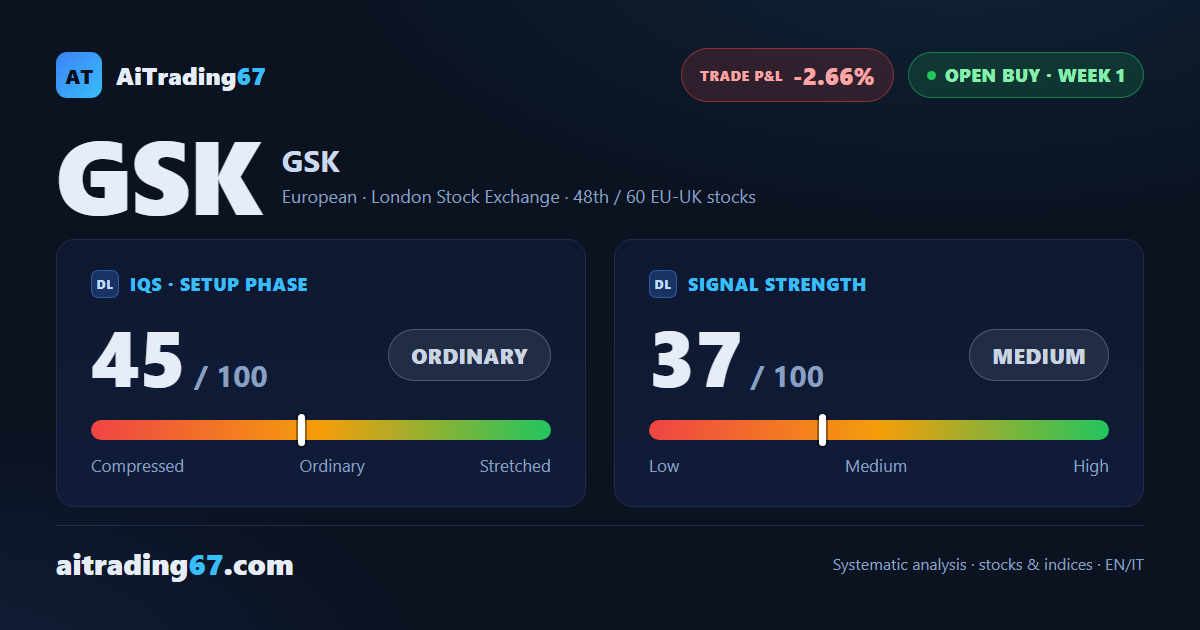
GSK: first week down, confirmation turns negative
GSK slips 2.7% in week one as the confirmation turns negative
GSK: first week down, confirmation turns negative
Our view last week
A fresh buy signal just triggered on GSK: it ranks 2nd among the 3 fresh Longs for European-UK stocks, with a signal strength of 47 out of 100. The weekly structure stays bullish, with the structural averages aligned, but the picture is still in transition — a cautious entry, reduced size, with confirmation to be read next week.
This week's summary
GSK shares slip 2.7% for the week, with sellers dominating the last bar and buyer dominance clearly fading. The weekly technical picture still shows a double bottom near the 1820 area, with an 8% intermediate rebound: the underlying structure stays bullish, even though the first week's confirmation turns negative.
IQS Phase
45
ordinary
Signal Strength
37
medium · weak
Sizing
REDUCED
Ranking
#48 / 60
EU-UK stocks in progress
Trade P&L %
-2.66%
from signal to today
restricted Platinum content