
GSK slips 2.3%: buy confirmation closes in the red
GSK slips 2.3% as the buy signal's second week closes in the red
GSK slips 2.3%: buy confirmation closes in the red
Our view last week
GSK shares slip 2.7% for the week, with sellers dominating the last bar and buyer dominance clearly fading. The weekly technical picture still shows a double bottom near the 1820 area, with an 8% intermediate rebound: the underlying structure stays bullish, even though the first week's confirmation turns negative.
This week's summary
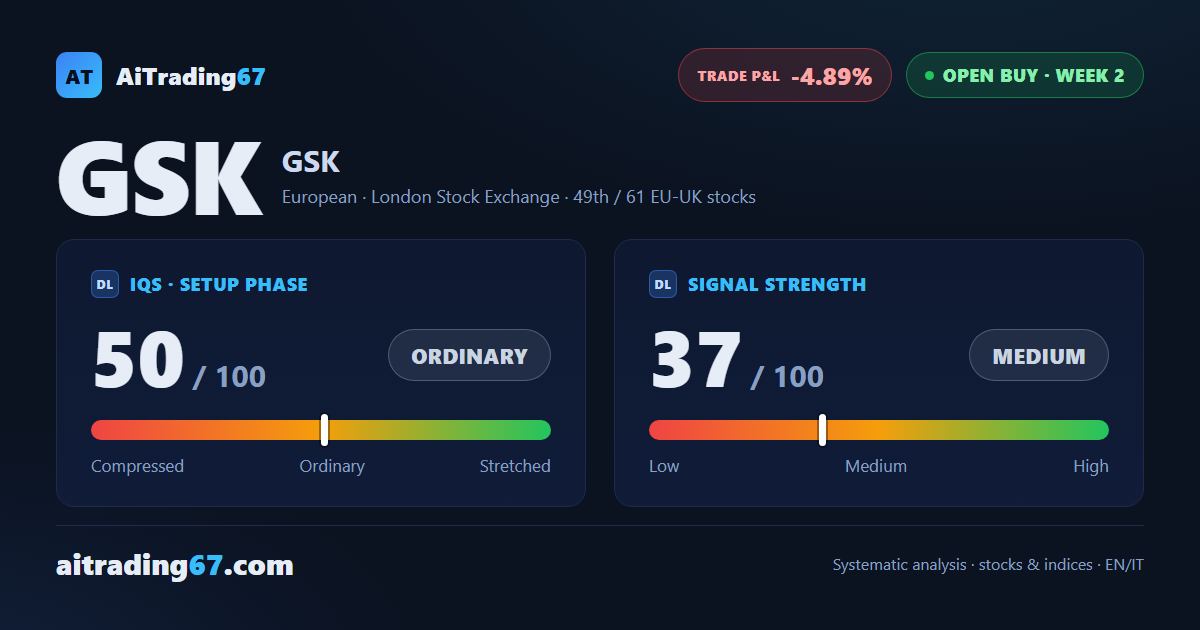
GSK shares slip 2.3% this week: the price action shows sellers slightly ahead in the last bar, with price falling on rising volume — a classic swing trading warning sign. This is the confirmation week for the buy signal that fired two weeks ago, and it closes in the red: our model reads an early-exit warning. The daily chart still holds a double bottom in the 1850 area, with an 11% rebound, and the weekly structure stays bullish but weaker.
IQS Phase
50
ordinary
Signal Strength
37
medium · weak
Sizing
REDUCED
Ranking
#49 / 61
EU-UK stocks in progress
Trade P&L %
-4.89%
from signal to today
restricted Platinum content