
The London-listed stock sits between technical compression and fading signals
GSK edges up 0.2%, but the closing candle hints at weakness
The London-listed stock sits between technical compression and fading signals
Our view last week
GSK shares slip 2.3% this week: the price action shows sellers slightly ahead in the last bar, with price falling on rising volume — a classic swing trading warning sign. This is the confirmation week for the buy signal that fired two weeks ago, and it closes in the red: our model reads an early-exit warning. The daily chart still holds a double bottom in the 1850 area, with an 11% rebound, and the weekly structure stays bullish but weaker.
This week's summary
GSK closes the week up 0.2%, but under the surface the signals are fading: the last candle shows price falling on rising volume, a classic divergence, and candle-body conviction keeps thinning out. The price stays compressed against the 50-week moving average and the weekly ADX is easing, a sign the trend is losing steam. The buy signal that fired three weeks ago is holding, but the confirmation week closed in the red and our model had already flagged an early-exit warning.
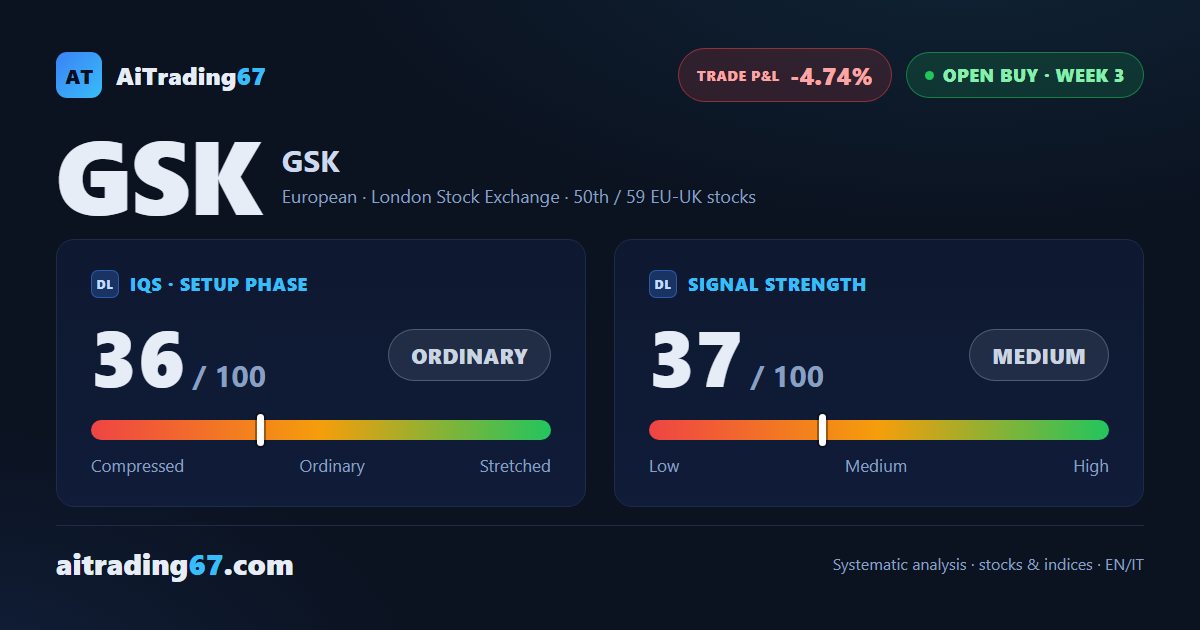
IQS Phase
36
ordinary
Signal Strength
37
medium · weak
Sizing
REDUCED
Ranking
#50 / 59
EU-UK stocks in progress
Trade P&L %
-4.74%
from signal to today
Rank position
ranks 50th among the 59 Longs already running for European-UK stocks in our ranking, with a signal strength of 37 out of 100.
Sector context
SectorEuropean
Benchmark ETFEXV4
Sector regimein positive regime
Performanceweekly +0.19% · monthly -0.21%
GSK belongs to the european sector (reference ETF EXV4). The sector is classified in positive regime according to our weekly reading.
restricted Platinum content