
Halliburton bounces off the 33 area, earnings just ahead
Halliburton climbs 2.4% ahead of earnings, with the decline running out of steam
Halliburton bounces off the 33 area, earnings just ahead
Our view last week
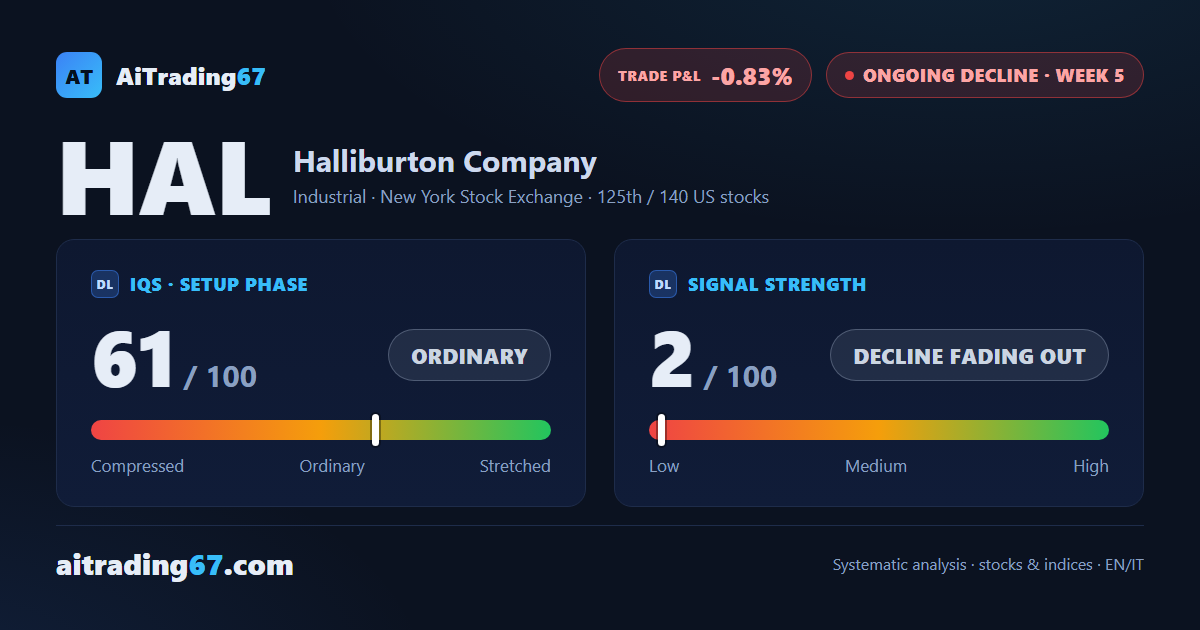
Halliburton bounces 4.3% this week off a clean double bottom in the 33 area, and the sell signal — now in its fourth week — loses steam: a decline without fresh momentum, per the Signal Strength reading. The stock is still 11.8% above its 200-week average, with earnings due in two weeks. Trading not recommended per our model.
This week's summary
Halliburton's bounce off the double bottom in the 33 area keeps going: this week the stock adds another 2.4%, pushing it 14.3% above its 200-week average. But money flow has turned negative just as price climbs, and on the last bar sellers stay slightly in charge. With earnings due this very week, caution still applies.
IQS Phase
61
ordinary
Signal Strength
2
decline fading out
Sizing
MINIMUM
Ranking
#125 / 140
US stocks
Trade P&L %
-0.83%
from signal to today
restricted Platinum content