
Home Depot holds a double bottom in week 4
Home Depot slips 1.3% but holds a double bottom in the 313 area
Home Depot holds a double bottom in week 4
Our view last week
Home Depot shares fell 4.1% this week, but the decline stopped at a clean double bottom in the 307 area, with an intermediate 4% bounce and daily buyers firmly in control, 83% of volume on the buy side. The open buy is in its third week and still up 2.70% since entry: this week's technical analysis shows a trend losing some shine, but the stop is already at breakeven and the trade's risk is off the table.
This week's summary
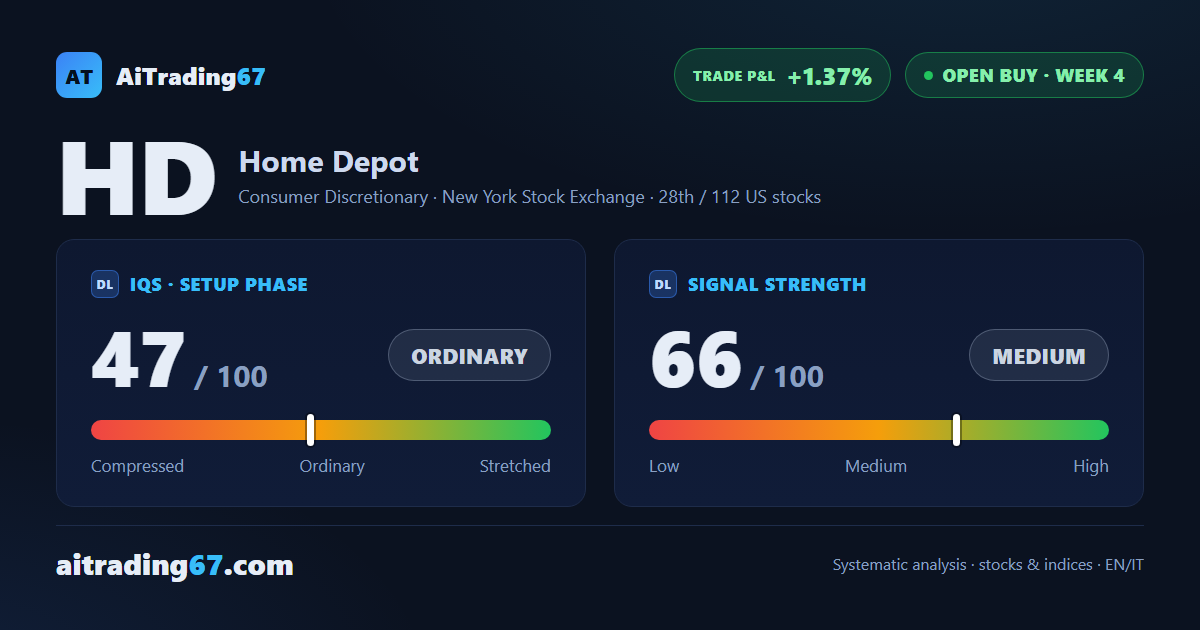
Home Depot shares gave back 1.3% this week, but the decline stopped at a clean double bottom in the 313 area, with an intermediate 6% bounce. Underneath, though, fatigue signs are piling up: buyers are losing ground and sellers dominated the last bar. The open buy is in its fourth week, up 1.37% since entry, with the stop already at breakeven: our weekly technical analysis calls for careful management from here.
IQS Phase
47
ordinary
Signal Strength
66
medium
Sizing
STANDARD
Ranking
#28 / 112
US stocks in progress
Trade P&L %
+1.37%
from signal to today
restricted Platinum content