
Home Depot squeezed between two levels
Home Depot slips 0.3%: sellers take control on the last bar, price squeezed between two walls
Home Depot squeezed between two levels
Our view last week
Home Depot shares gave back 1.7% this week, but the decline stopped at a clean double bottom in the 320 area, with an intermediate 7% bounce. Underneath, though, sellers still dominate the last bar and candle bodies keep fading. Price closed below the breakeven stop flagged in last week's card (334.28 area): for anyone following that level the trade is closed. Our weekly technical analysis keeps tracking Home Depot until the signal eventually reverses.
This week's summary
Home Depot closes the week down 0.3%, squeezed between the 50-day average in the 334 area and the daily pivot in the 331.6 area. Underneath, sellers dominate the last bar and cash flow turns negative, even as buyers still hold above 60% of volume: a mixed picture. Room toward the highs stays wide, with no nearby historical resistance.
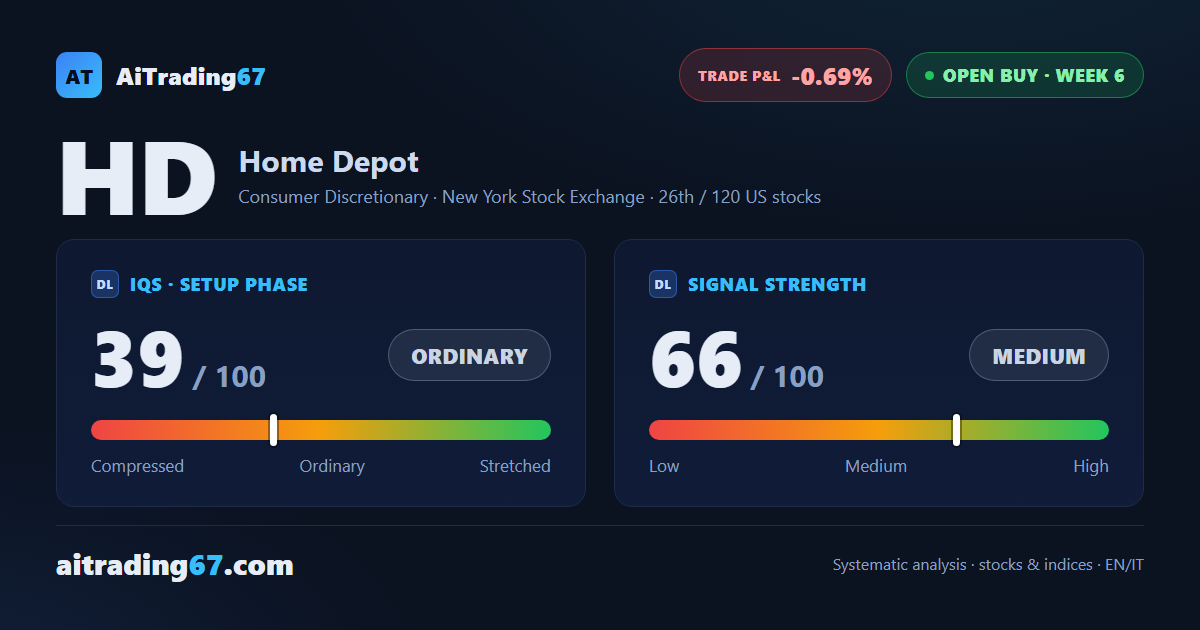
IQS Phase
39
ordinary
Signal Strength
66
medium
Sizing
STANDARD
Ranking
#26 / 120
US stocks in progress
Trade P&L %
-0.69%
from signal to date, no stop loss
Rank position
ranks 26th among the 120 Longs already running for US stocks in our ranking, with a signal strength of 66 out of 100.
Sector context
SectorConsumer Discretionary
Benchmark ETFXLY
Sector regimein positive regime
Performanceweekly +6.11% · monthly -1.69%
HD belongs to the consumer discretionary sector (reference ETF XLY). The sector is classified in positive regime according to our weekly reading.
restricted Platinum content