Sell signal · week 6
Hera: double bottom tests the durability of the decline
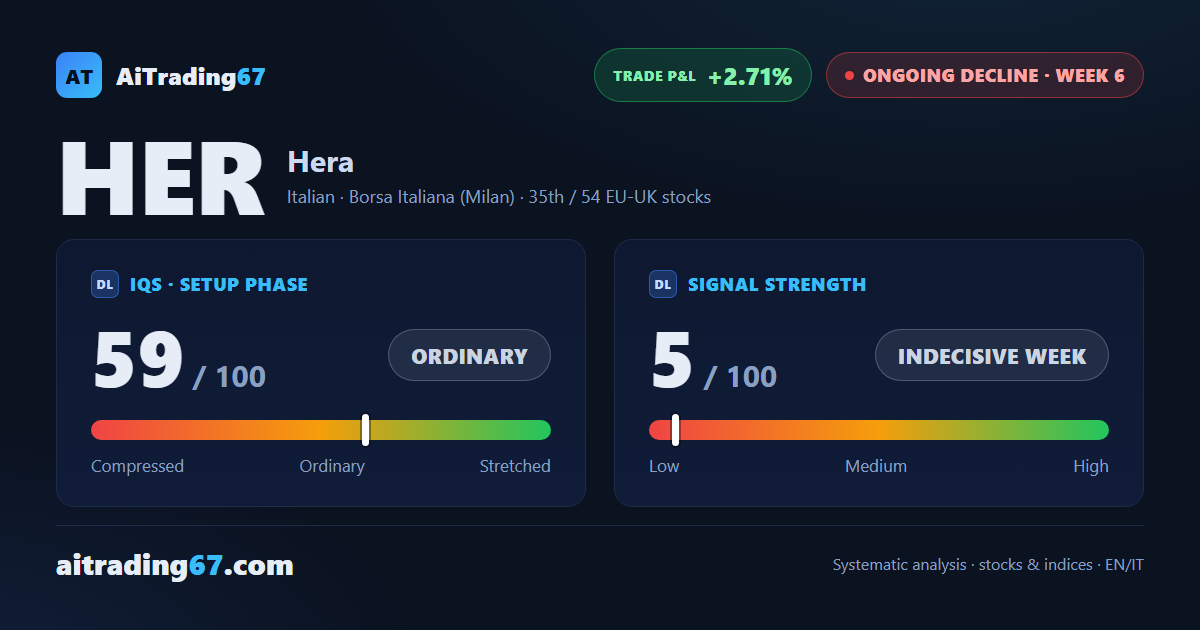
Sell signal · week 6
In Summary
At week 6 of a sell signal, Hera closes with a slight gain after three consecutive down weeks, forming a double bottom in the 3.7 area. The technical picture is nuanced: buyers returned at 66%, but MACD remains negative and CMF stays in distribution territory. Is this a pause or the start of exhaustion?
IQS Phase
59
ordinary
Signal Strength
5
indecisive week
Sizing
MINIMUM
Ranking
#35 / 54
EU-UK stocks
Trade P&L %
+2.71%
from signal to today
restricted Platinum content