
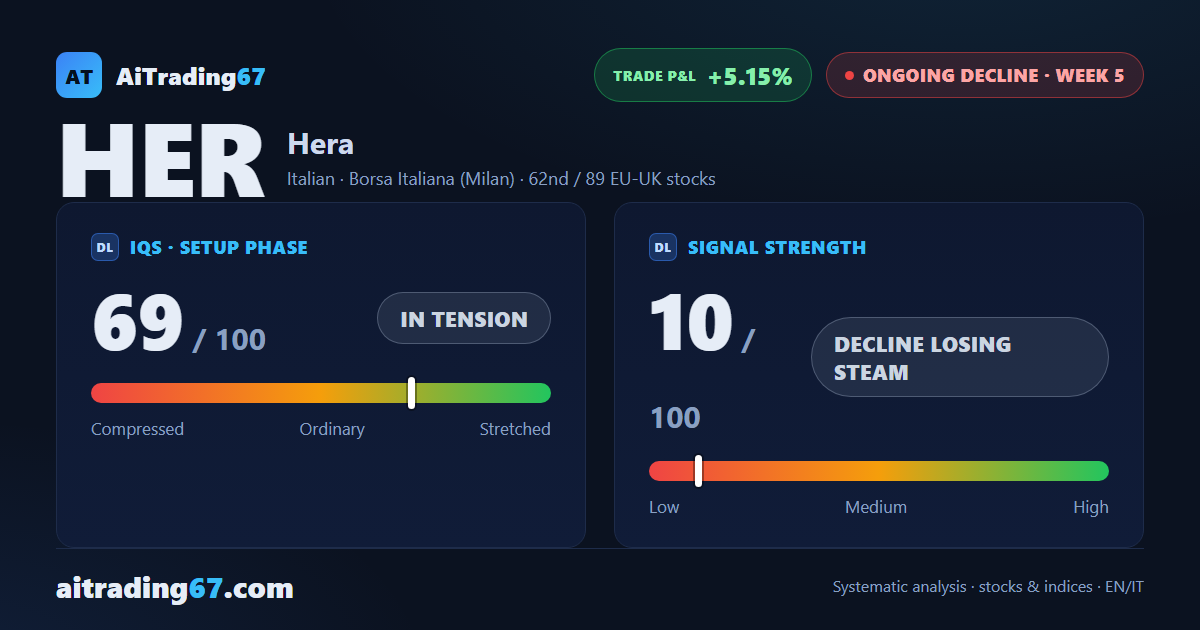
Ongoing decline · week 5 of the sell signal
Hera slips 0.6%: a new 30-week low that the weekly close fails to confirm
Our view last week
The 200-week moving average held a week ago; this time it gave way. Hera closes down 1.3%, its fifth losing week in a row, and money flow drops below zero after 12 positive weeks. The weekly price action shows sellers dominating to an extreme, even as volumes contract. For Hera stock, technical analysis points to a decline starting to make lower lows, with the price pressed right against its 30-day low.
This week's summary
Hera slips another 0.6% and prints a new 30-week low this week, in the 3.48 area, which the weekly close fails to confirm. Last week the 200-week moving average gave way; now that same average, in the 3.59 area, acts as resistance, and price came close without touching it. For Hera stock, technical analysis shows price action still weak: a 6th straight weekly decline, money flow turning more negative, volumes contracting. The short trade setup is up 5.15%.
IQS Phase
69
in tension
Signal Strength
10
decline losing steam
Sizing
MINIMUM
Ranking
#62 / 89
EU-UK stocks
Trade P&L %
+5.15%
from signal to date, no stop loss
Hera (HER) weekly chart — EMA50 · MACD · VWAP
Weekly chart · EMA50 · MACD · VWAP · Source: TradingView
Rank position
ranks 62nd among the 89 sell signals for European-UK stocks in our ranking, with a signal strength of 10 out of 100.
Sector context
SectorItalian
Benchmark ETFEXH9
Sector regimein positive regime
Performanceweekly +0.55% · monthly +1.10%
HER belongs to the italian sector (reference ETF EXH9). The sector is classified in positive regime according to our weekly reading.
restricted Platinum content