
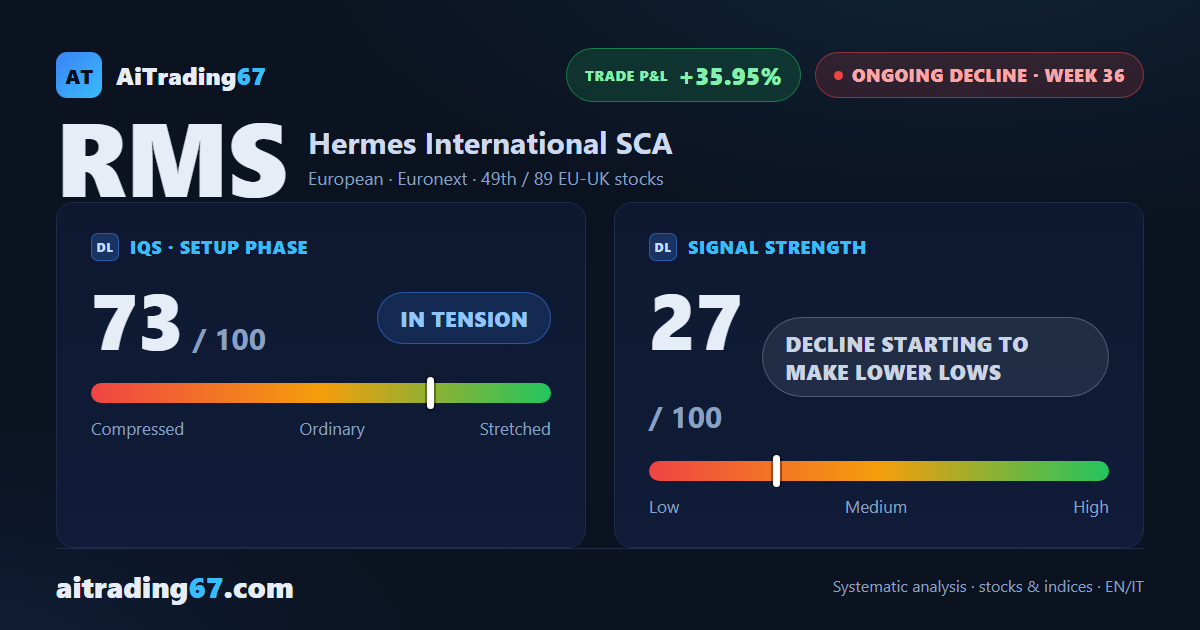
Decline under management · week 36
Hermes drops 3.6% to a new 90-week low that the weekly close fails to confirm
Our view last week
After 3 weeks of one-way selling, buyers took back 67% of the week's volume, a week after sellers held 89% of it. Hermès stock closed 1.2% higher, yet the daily price action still traces 3 lower highs and the weekly MACD keeps weakening. A breather inside a decline that remains intact, with the short more than 33% in profit.
This week's summary
Last week's breather is already over: Hermes stock fell 3.6% and printed a new 90-week low during the week, one the weekly close did not confirm. The weekly technical analysis still points one way: RSI below 30, MACD histogram falling for 5 weeks, money flow at its most negative reading in 4 weeks. For swing trading and price action trading alike the read is unchanged: the decline has resumed, with the short more than 35% in profit.
IQS Phase
73
in tension
Signal Strength
27
decline starting to make lower lows
Sizing
MINIMUM
Ranking
#49 / 89
EU-UK stocks
Trade P&L %
+35.95%
from signal to date, no stop loss
Hermes International SCA (RMS) weekly chart — EMA50 · MACD · VWAP
Weekly chart · EMA50 · MACD · VWAP · Source: TradingView
Rank position
ranks 49th among the 89 sell signals for European-UK stocks in our ranking, with a signal strength of 27 out of 100.
Sector context
SectorEuropean
Benchmark ETFEXH7
Sector regime
Performanceweekly coming soon · monthly coming soon
RMS belongs to the european sector (reference ETF EXH7).
restricted Platinum content