
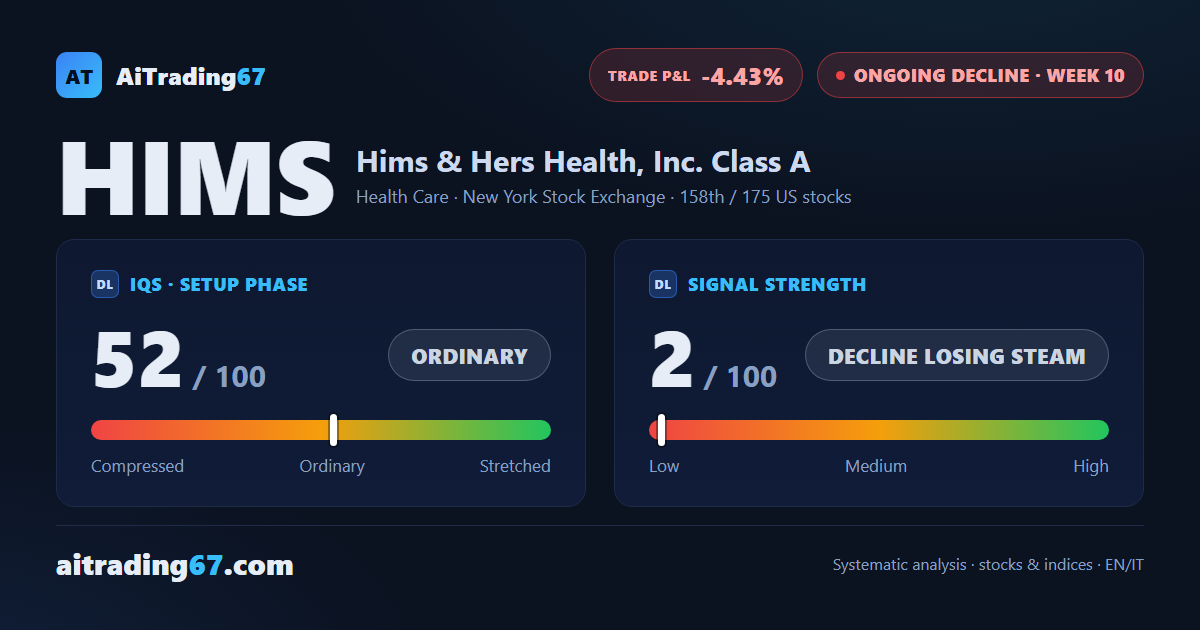
Ongoing decline, week 10
Hims & Hers slips 1.4% as the rebound stalls under its 50- and 200-day averages
Our view last week
Hims & Hers stock rose 5.1%, its second straight weekly gain, with a 4% bounce off the 20-day moving average in the 29 area. Compared with a week ago, sellers lost ground, from 63% to 53% of volume, and the MACD histogram turned up after 4 weeks of declines. Money flow has been below zero for 5 weeks: for swing trading, this technical analysis reads a slowing decline, with price action still flagging distribution on one of the US stocks to watch.
This week's summary
The Hims & Hers rebound has stalled under its 50- and 200-day moving averages, between the 29.4 and 30.5 areas: the week closed down 1.4% after 2 straight gains, and the price slipped back below the 20-day average it had reclaimed a week earlier. This technical analysis of Hims & Hers stock reads a slowing decline: money flow has been negative for 6 weeks but improving for 3, and the MACD histogram is rising. For swing trading on US stocks, price action still flags distribution.
IQS Phase
52
ordinary
Signal Strength
2
decline losing steam
Sizing
MINIMUM
Ranking
#158 / 175
US stocks
Trade P&L %
-4.43%
from signal to date, no stop loss
Hims & Hers Health (HIMS) weekly chart — EMA50 · MACD · VWAP
Weekly chart · EMA50 · MACD · VWAP · Source: TradingView
Rank position
ranks 158th among the 175 sell signals for US stocks in our ranking, with a signal strength of 2 out of 100.
Sector context
SectorHealth Care
Benchmark ETFXLV
Sector regimein positive regime
Performanceweekly -2.65% · monthly -3.91%
HIMS belongs to the health care sector (reference ETF XLV). The sector is classified in positive regime according to our weekly reading.
restricted Platinum content