
Sell signal stalls as stock bounces off its 20-day average
Honeywell dips 1.5% and bounces off its 20-day average: the sell signal stays stuck
Sell signal stalls as stock bounces off its 20-day average
Our view last week
Honeywell reaches week 4 of a sell signal that is losing ground: the week just closed down only 1.0%, an increasingly faint pace, with price climbing back toward the Inversion Point. Signal strength drops to 16 out of 100, consistent with a decline fading out. The setup quality indicator sits at 40 out of 100, in the ordinary band, and Honeywell ranks 134th among the 137 US sell signals.
This week's summary
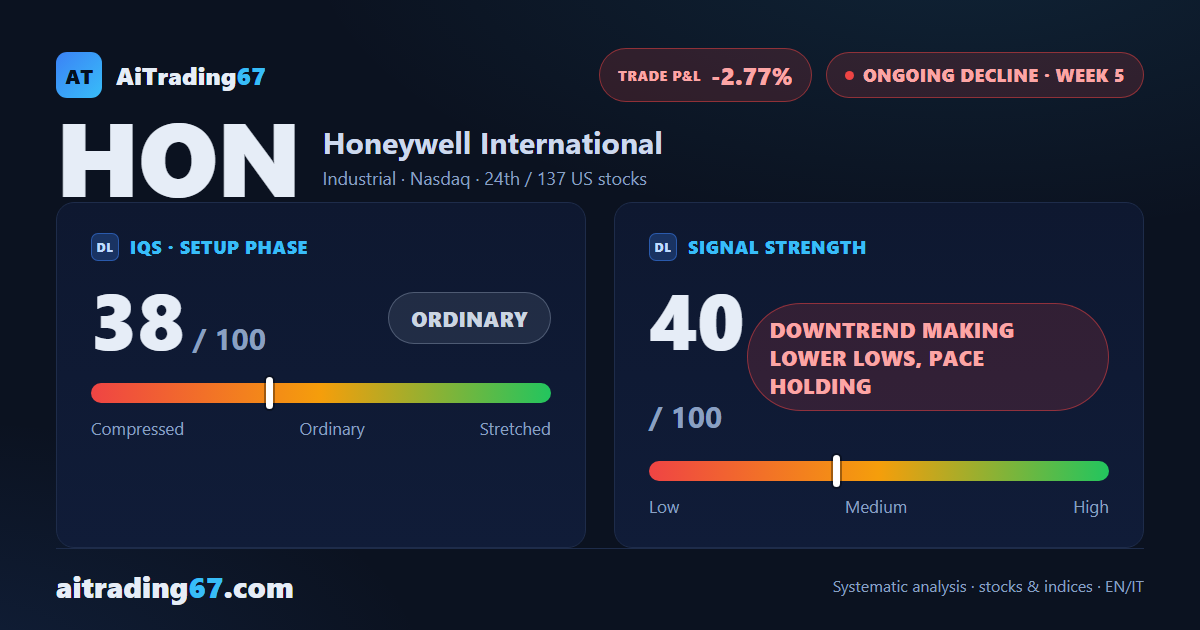
Honeywell's sell signal is in its 5th week of management, and the short is running a modest loss, at -2.77%. The week closed down 1.5%, but the stock had dropped to the 219 area before bouncing 4% off its 20-day moving average, in the 225 area. Volume is back in balance, money flow stays positive, and momentum holds the jump from recent weeks: for now, the decline isn't finding confirmation.
IQS Phase
38
ordinary
Signal Strength
40
downtrend making lower lows, pace holding
Sizing
REDUCED
Ranking
#24 / 137
US stocks
Trade P&L %
-2.77%
from signal to today
restricted Platinum content