
Sell signal, week 7: the rebound slows
Honeywell adds 0.7%: a third straight weekly gain on thinning volume, under its averages
Our view last week
Honeywell's money flow turns positive after 5 weeks below zero, and the week closes up 2.9% with 88% of volume on the buy side, the highest reading in 4 weeks. On the daily chart, price action prints a bullish engulfing. Among US stocks under a sell signal, Honeywell's short is still 1.55% in profit, down from 4.4% a week ago: the technical analysis shows a decline that is slowing, with price squeezed between resistance in the 213.6 area and support in the 212.3 area.
This week's summary
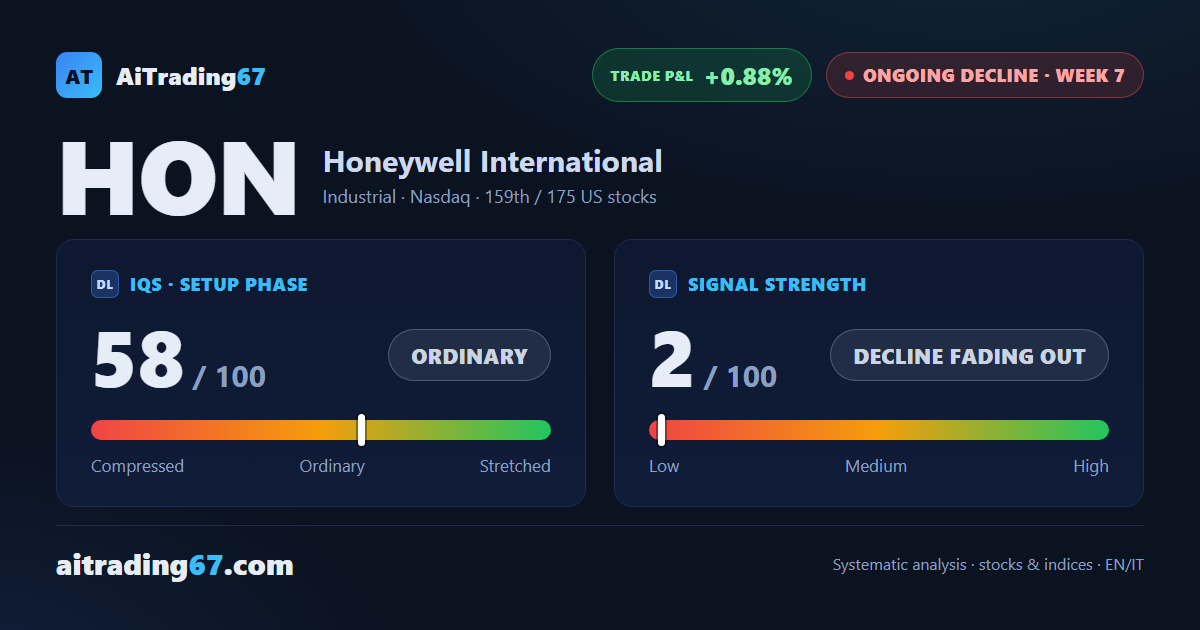
Honeywell's weekly money flow, which turned positive last week, has slipped back below zero, and a third straight weekly gain stops at +0.7% on contracting volume. Honeywell stock bounced off its 20-day moving average, in the 211.5 area, and still sits below its 50-week average. On the technical analysis the Sell signal stays live, with the short less than 1% in profit: for swing trading among US stocks, the price action reads as a rebound losing pace.
IQS Phase
58
ordinary
Signal Strength
2
decline fading out
Sizing
MINIMUM
Ranking
#159 / 175
US stocks
Trade P&L %
+0.88%
from signal to date, no stop loss
Honeywell International (HON) weekly chart — EMA50 · MACD · VWAP
Weekly chart · EMA50 · MACD · VWAP · Source: TradingView
Rank position
ranks 159th among the 175 sell signals for US stocks in our ranking, with a signal strength of 2 out of 100.
Sector context
SectorIndustrial
Benchmark ETFXLI
Sector regimeweak phase
Performanceweekly -0.28% · monthly -1.64%
HON belongs to the industrial sector (reference ETF XLI). The sector is classified weak phase according to our weekly reading.
restricted Platinum content