
Robinhood pauses after the run, trend still holds
Robinhood: -0.7% this week, but ADX and momentum build beneath the candle
Robinhood pauses after the run, trend still holds
Our view last week
Robinhood is at week 11 of an open buy, up 24.2% since entry. Coverage from our most advanced model is already complete: all 3 targets were hit along the way. The residual capital now continues under a dynamic stop, tighter than the structural level, while the weekly structure remains solidly bullish.
This week's summary
Robinhood shares close the week almost flat, -0.7%, but beneath the surface the picture is accelerating: volume tips toward selling (70% versus 33% a week earlier) and the daily candle closes as a bearish engulfing bar, with sellers slightly in charge. In Robinhood's technical analysis it's the first note of caution after a clean stretch of strength; the trade still sits above 23% profit since entry.
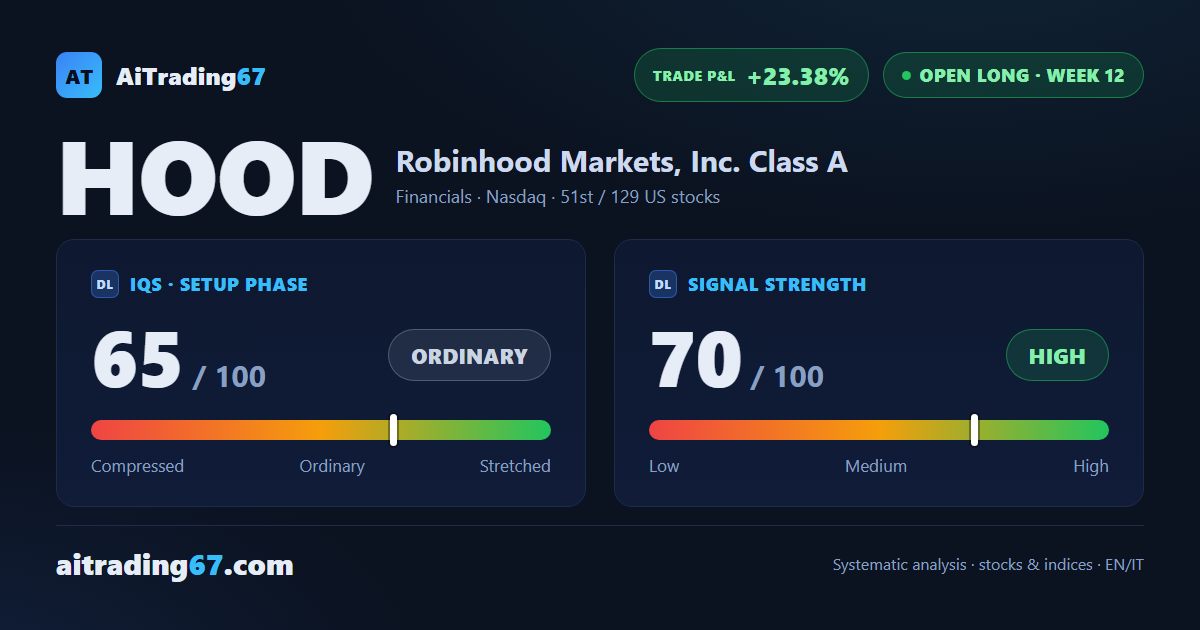
IQS Phase
65
ordinary
Signal Strength
70
high · wide & volatile
Sizing
FULL
Ranking
#51 / 129
US stocks in progress
Trade P&L %
+23.38%
from signal to today
restricted Platinum content