
Robinhood retests the 97 area
Robinhood drops 10.7% and bounces off its 50-day average
Robinhood retests the 97 area
Our view last week
Robinhood shares close the week almost flat, -0.7%, but beneath the surface the picture is accelerating: volume tips toward selling (70% versus 33% a week earlier) and the daily candle closes as a bearish engulfing bar, with sellers slightly in charge. In Robinhood's technical analysis it's the first note of caution after a clean stretch of strength; the trade still sits above 23% profit since entry.
This week's summary
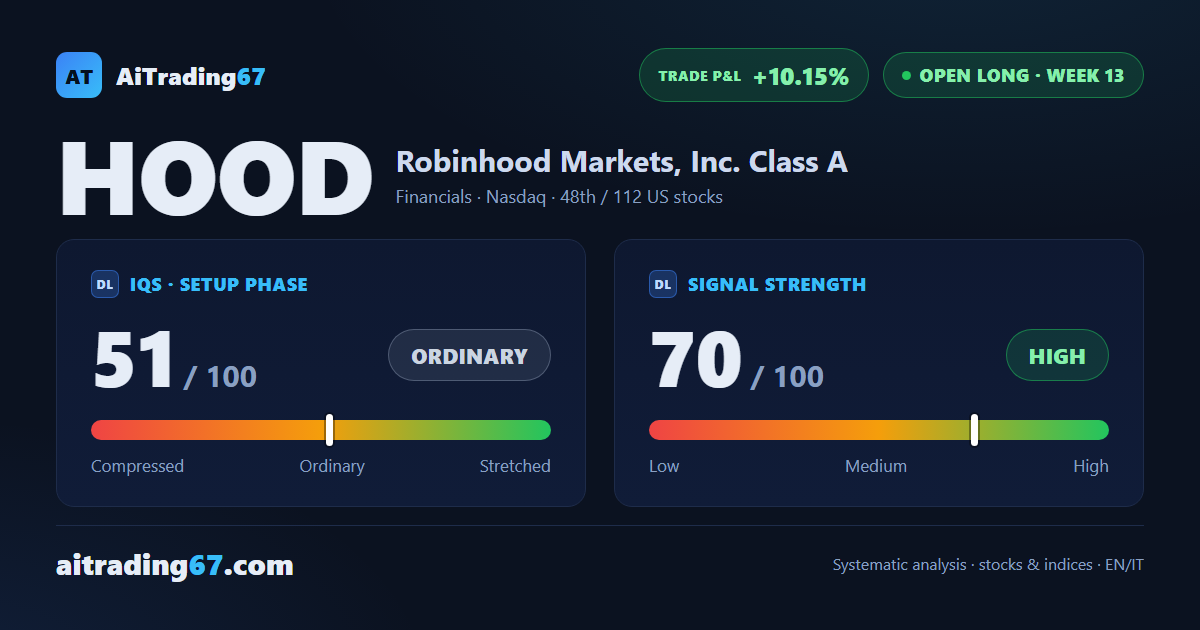
Robinhood shares drop 10.7% in the week just closed, with sellers still in charge: 83% of volume is on the sell side, up from 70% a week earlier. The caution flagged last week has been confirmed. On the daily chart, though, price tapped its own 50-day moving average, in the 97 area, and bounced 4% from there. In Robinhood's technical analysis the trade still sits in double-digit profit since entry.
IQS Phase
51
ordinary
Signal Strength
70
high · wide & volatile
Sizing
FULL
Ranking
#48 / 112
US stocks in progress
Trade P&L %
+10.15%
from signal to today
restricted Platinum content