
Buy signal, week 10
HP Inc. gains 2.6% and breaks its run of lower highs on the daily chart
Our view last week
A heavy week for HP Inc. stock: shares fall 9% and the weekly price action is blunt, with sellers extremely dominant, buying below a quarter of volume and the drop coming on turnover in line with its average. After 4 weeks led by buyers, sellers have taken the wheel. The underlying picture holds: price stays above the 50-week average and money flow has been positive for 7 weeks. It remains among our weekly buy signals on tech stocks, up 21.6% from entry.
This week's summary
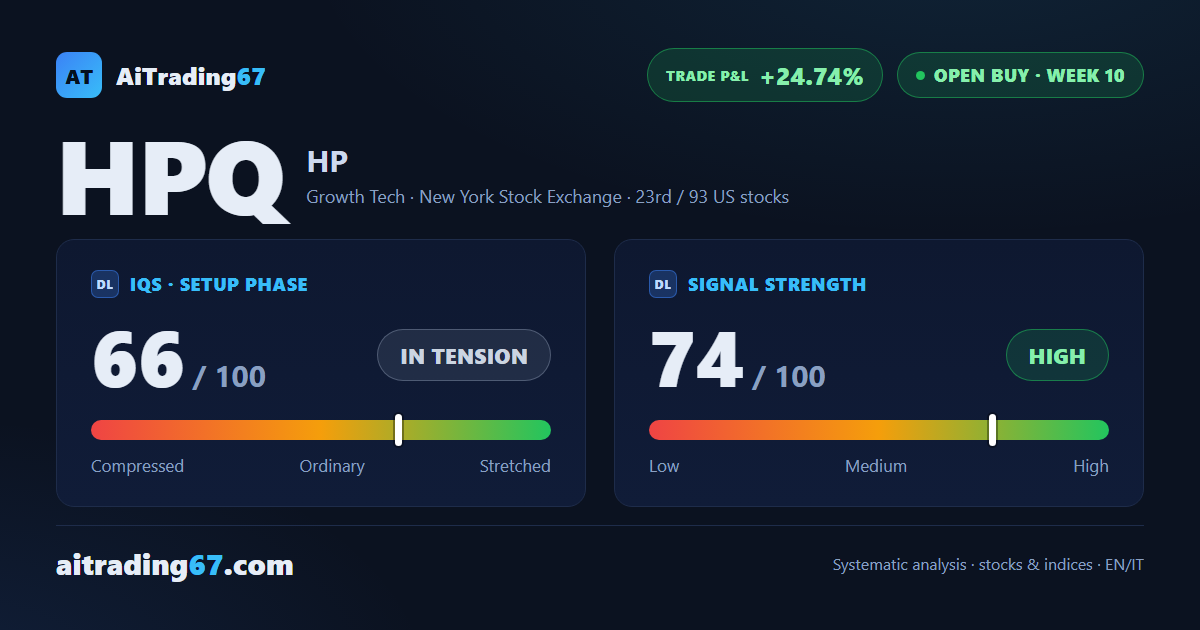
After last week's 9% drop, HP Inc. stock gained 2.6% and, on the daily chart, broke the run of 3 lower highs in place since Sep 11. Price action turns constructive again, but momentum is cooling: the weekly MACD histogram has been falling for 3 weeks and money flow, positive for 8, has been weakening for 3. HP Inc. stays among our weekly buy signals on tech stocks, up 24.7% from entry: technical analysis of a mature, volatile swing trading setup.
IQS Phase
66
in tension
Signal Strength
74
high · wide & volatile
Sizing
FULL
Ranking
#23 / 93
US stocks in progress
Trade P&L %
+24.74%
from signal to date, no stop loss
HP (HPQ) weekly chart — EMA50 · MACD · VWAP
Weekly chart · EMA50 · MACD · VWAP · Source: TradingView
Rank position
ranks 23rd among the 93 Longs already running for US stocks in our ranking, with a signal strength of 74 out of 100.
Sector context
SectorGrowth Tech
Benchmark ETFXLK
Sector regimein strong phase
Performanceweekly +1.80% · monthly +8.83%
HPQ belongs to the growth tech sector (reference ETF XLK). The sector is classified in strong phase according to our weekly reading.
restricted Platinum content