
HP Inc.: the Sell signal nears its finish line
HP Inc. gains 2.6% as buyers return and the Sell signal fades out
HP Inc.: the Sell signal nears its finish line
Our view last week
HP Inc. shares rebound 10.4% this week, climbing off the daily EMA20 — the 23 area, a 6% bounce off the touch — and the Sell signal, in its third week, comes out weaker for it: signal strength drops to 22 out of 100 and reads "decline fading out," with price back at the edge of the Inversion Point. Beneath the surface, though, daily money flow stays negative and buyers make up just 13% of volume: a bounce the tape hasn't fully confirmed yet.
This week's summary
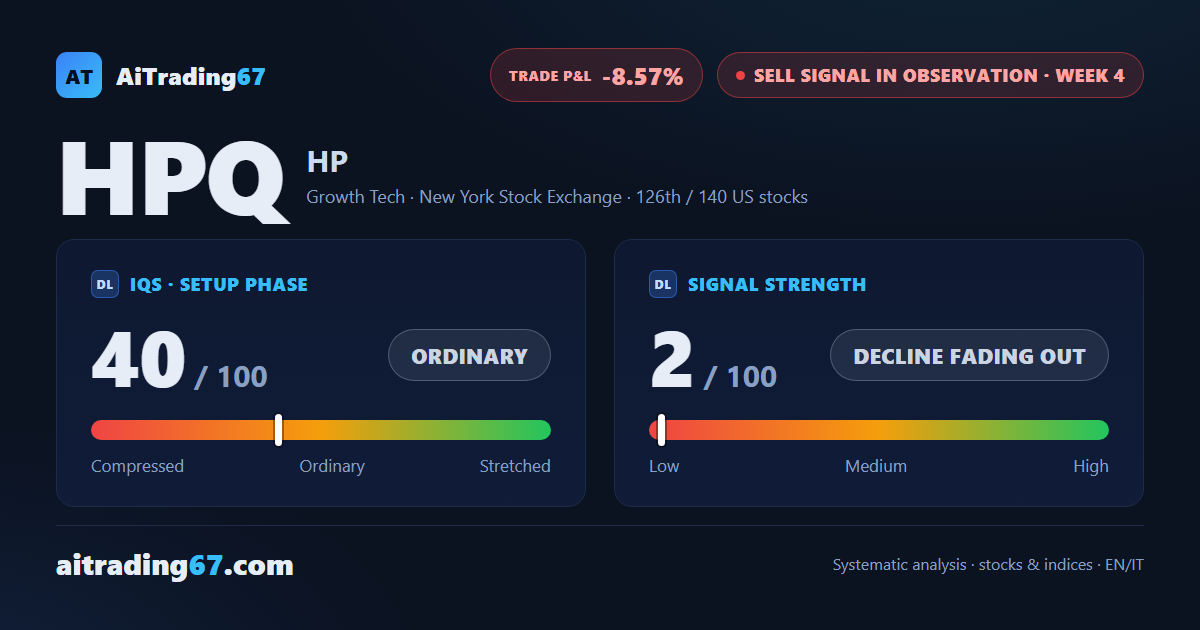
On HP Inc., buyers are back in charge: 75% of daily volume is on the buy side, and money flow, negative in recent weeks, has turned positive. Price is boxed between the daily pivot average in the 24.65 area and the upper Bollinger Band in the 25.18 area. After last week's 10% bounce, the Sell signal keeps losing strength — now just 2 out of 100 — and the picture points to a decline running out of road.
IQS Phase
40
ordinary
Signal Strength
2
decline fading out
Sizing
MINIMUM
Ranking
#126 / 140
US stocks sell signals
Trade P&L %
-8.57%
from signal to today
restricted Platinum content