
IBKR: rally stalls on a rejection at the highs
Interactive Brokers gains 3% to new highs, but the candle marks a firm rejection
IBKR: rally stalls on a rejection at the highs
Our view last week
Interactive Brokers is in week 11 of a buy signal, up 11.77% since entry. The 3 targets of our most advanced model have been hit and coverage is complete: the stop now tracks the Inversion Point, in the 86 area. The price is hugging the highs, with the Financials sector in a strength phase.
This week's summary
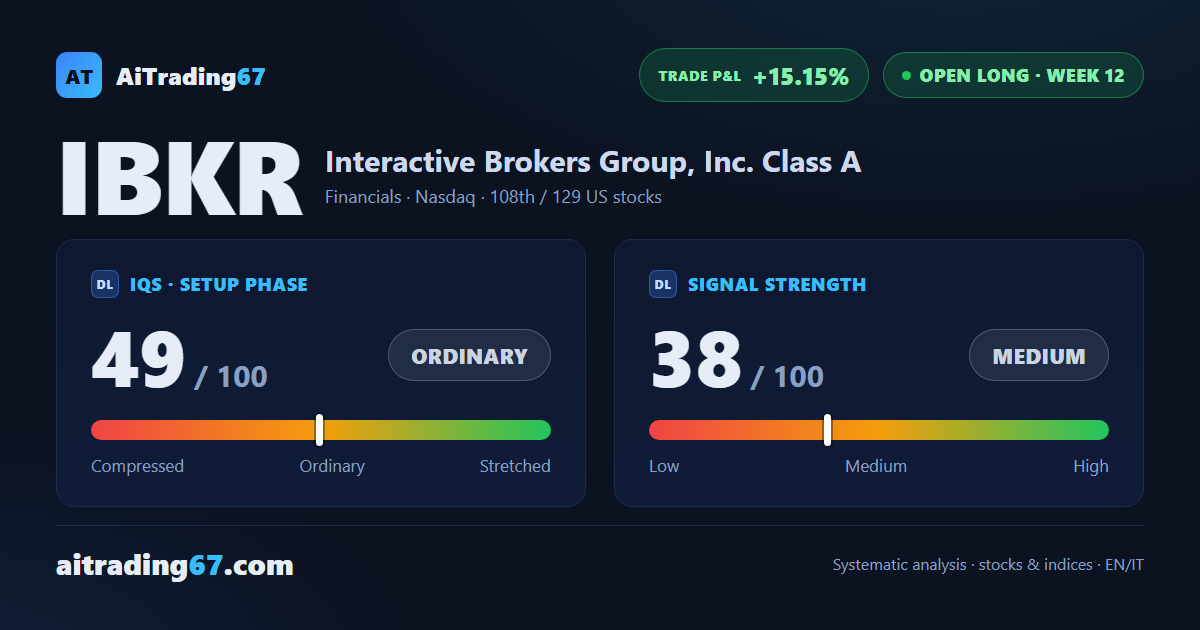
Interactive Brokers gains 3% this week and prints a fresh 30-day high, but the candle closes with a firm rejection: sellers slightly in control, money flow back negative and the MACD histogram shrinking for a fourth straight week. The trade, in week 12 and up more than 15%, holds its direction but is running on less fuel. Earnings land in two weeks, on July 21: caution for anyone looking to add here.
IQS Phase
49
ordinary
Signal Strength
38
medium · weak
Sizing
REDUCED
Ranking
#108 / 129
US stocks in progress
Trade P&L %
+15.15%
from signal to today
restricted Platinum content