
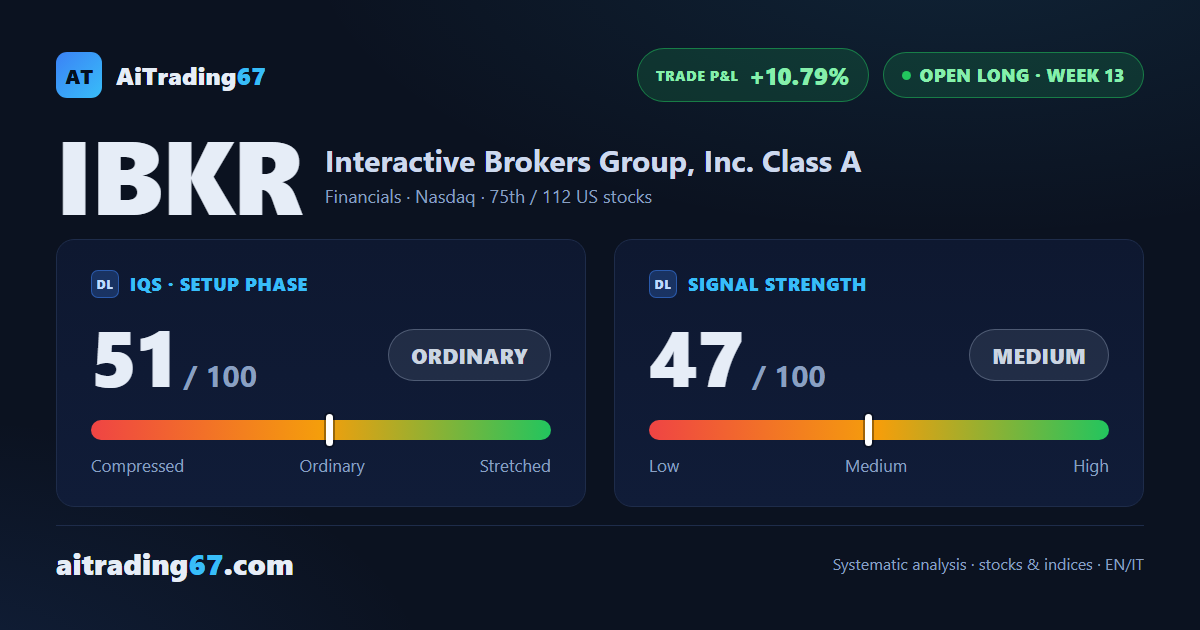
13th week of management, earnings this week
Interactive Brokers slips 3.8%: the rally cools but the structure holds
13th week of management, earnings this week
Our view last week
Interactive Brokers gains 3% this week and prints a fresh 30-day high, but the candle closes with a firm rejection: sellers slightly in control, money flow back negative and the MACD histogram shrinking for a fourth straight week. The trade, in week 12 and up more than 15%, holds its direction but is running on less fuel. Earnings land in two weeks, on July 21: caution for anyone looking to add here.
This week's summary
Interactive Brokers slips 3.8% this week, with sellers taking 73% of the volume and the MACD histogram falling for a fourth straight week: the momentum that held up last week's fresh 30-day high is now genuinely easing. The stock stays boxed between the 90 and 93 area, with earnings landing this very week, on July 21.
IQS Phase
51
ordinary
Signal Strength
47
medium · weak
Sizing
REDUCED
Ranking
#75 / 112
US stocks in progress
Trade P&L %
+10.79%
from signal to today
restricted Platinum content