
A 1.3% bounce, but money keeps flowing out
Interactive Brokers climbs 1.3% but money flow stays in the red for a 4th week
A 1.3% bounce, but money keeps flowing out
Our view last week
Interactive Brokers slips 3.8% this week, with sellers taking 73% of the volume and the MACD histogram falling for a fourth straight week: the momentum that held up last week's fresh 30-day high is now genuinely easing. The stock stays boxed between the 90 and 93 area, with earnings landing this very week, on July 21.
This week's summary
Interactive Brokers closes the week with a 1.3% rebound, but under the surface the picture is getting messier: money flow has been negative for a fourth straight week and momentum keeps deflating, while sellers still control 63% of the volume. The weekly technical analysis points to a trend losing conviction: Interactive Brokers stock stays stuck in a holding pattern, with earnings now behind it.
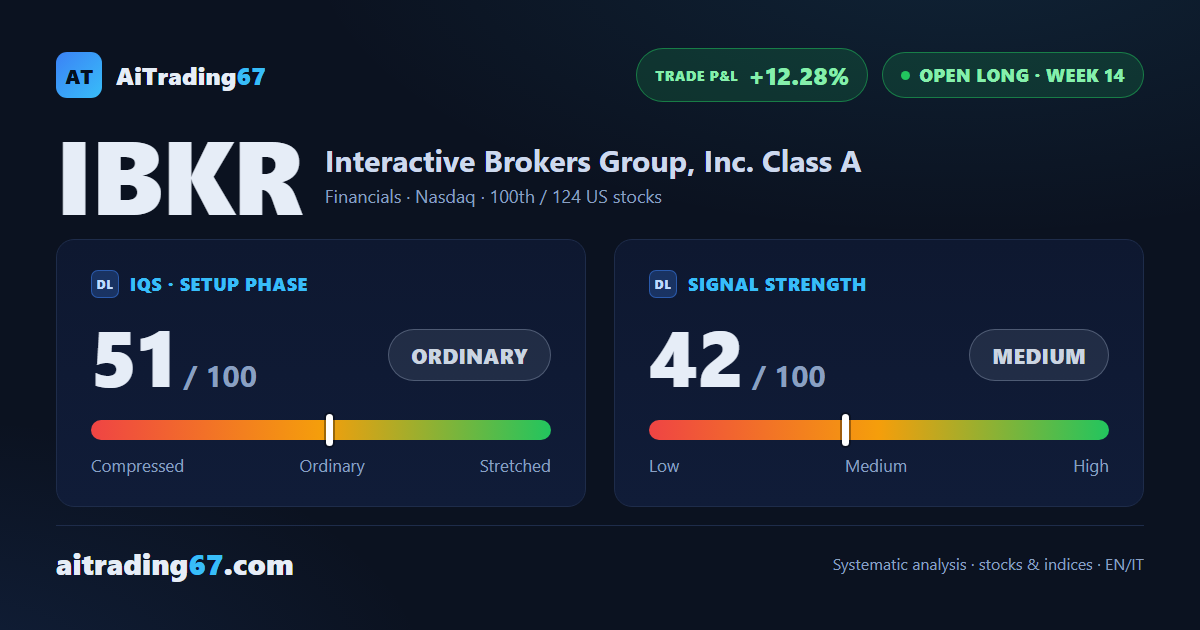
IQS Phase
51
ordinary
Signal Strength
42
medium · weak
Sizing
REDUCED
Ranking
#100 / 124
US stocks in progress
Trade P&L %
+12.28%
from signal to today
Rank position
ranks 100th among the 124 Longs already running for US stocks in our ranking, with a signal strength of 42 out of 100.
Sector context
SectorFinancials
Benchmark ETFXLF
Sector regimein positive regime
Performanceweekly +0.09% · monthly +4.82%
IBKR belongs to the financials sector (reference ETF XLF). The sector is classified in positive regime according to our weekly reading.
restricted Platinum content