
Interactive Brokers: the rally cools after a strong month
Interactive Brokers stock drops 4.1% as the buy signal loses steam
Interactive Brokers: the rally cools after a strong month
Our view last week
Interactive Brokers closes the week with a 1.3% rebound, but under the surface the picture is getting messier: money flow has been negative for a fourth straight week and momentum keeps deflating, while sellers still control 63% of the volume. The weekly technical analysis points to a trend losing conviction: Interactive Brokers stock stays stuck in a holding pattern, with earnings now behind it.
This week's summary
Interactive Brokers stock gave back 4.1% this week, with a bearish engulfing bar on the daily chart and sellers taking 72% of the volume. On the weekly the MACD just crossed bearish and the ADX is slowing: the trend is losing conviction after a month of push. The weekly technical analysis still holds above every structural moving average, and the trade remains up 7.7% since entry.
IQS Phase
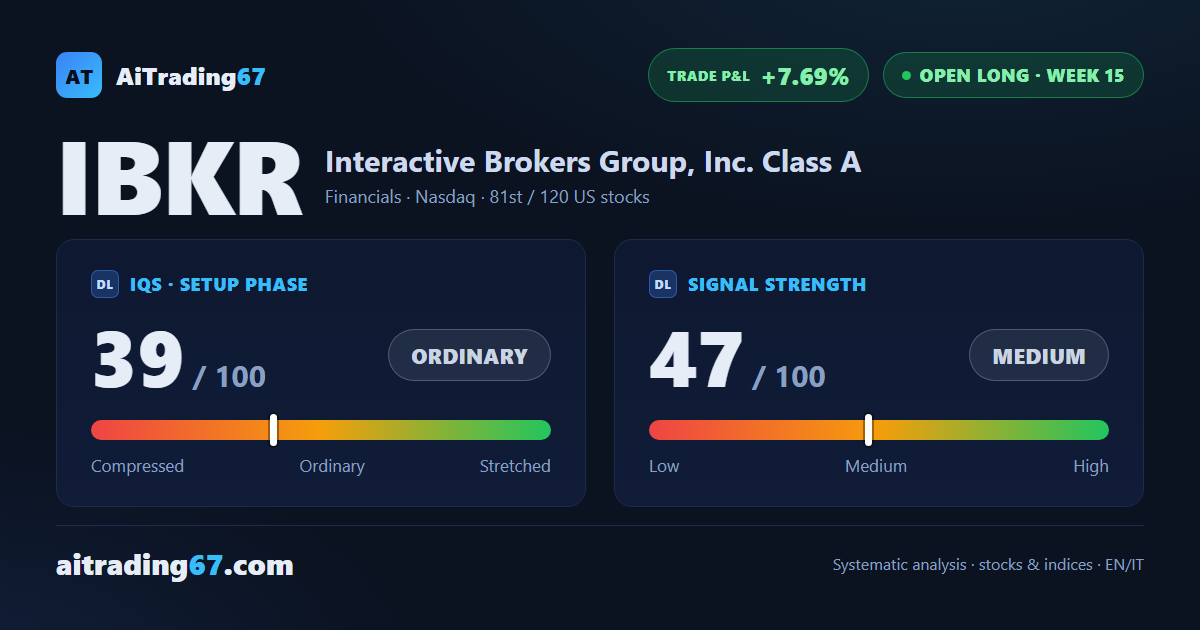
39
ordinary
Signal Strength
47
medium · weak
Sizing
REDUCED
Ranking
#81 / 120
US stocks in progress
Trade P&L %
+7.69%
from signal to date, no stop loss
Rank position
ranks 81st among the 120 Longs already running for US stocks in our ranking, with a signal strength of 47 out of 100.
Sector context
SectorFinancials
Benchmark ETFXLF
Sector regimein strong phase
Performanceweekly +1.12% · monthly +3.94%
IBKR belongs to the financials sector (reference ETF XLF). The sector is classified in strong phase according to our weekly reading.
restricted Platinum content