
From buy signal to sell in just one week
IBM sinks 26% in a single week and flips the signal from buy to sell
From buy signal to sell in just one week
Our view last week
IBM's stock turns a corner in a single week: the sell signal that had followed it for three weeks gives way to a fresh buy signal, the strongest of six new US Longs with a signal strength of 72 out of 100. But the last bar saw sellers take firm control, and price is working within a step of its all-time highs — our technical analysis flags trading as not recommended, and discipline calls for a pullback before stepping in.
This week's summary
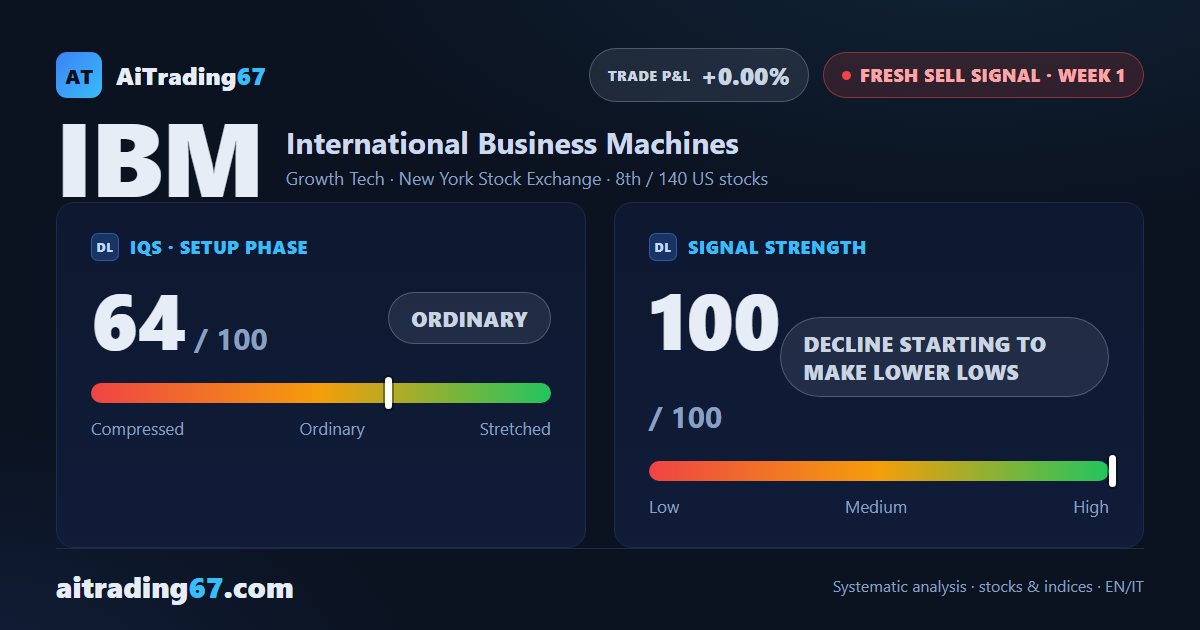
IBM just went through a brutal week: the stock sheds 26% and sinks below its weekly Ichimoku cloud, with sellers firmly in charge of the last bar. Only seven days ago the picture was the opposite, a fresh buy signal; now a new sell signal kicks in with signal strength maxed out, a decline already making lower lows. Earnings are due this week.
IQS Phase
64
ordinary
Signal Strength
100
decline starting to make lower lows
Sizing
STANDARD
Ranking
#8 / 140
New us stocks
Trade P&L %
+0.00%
from signal to today
restricted Platinum content