
Infineon retests its Inversion Point support
Infineon slips 6.3% and retests the 72 area, where the double bottom holds
Infineon retests its Inversion Point support
Our view last week
Infineon Technologies is in week 11 of a buy signal, running at +58.24% since entry. All 3 targets of our most advanced model have already been hit: coverage is complete, and the stop now trails the Inversion Point, in the 71 area. The stock ranks 2nd among the 62 European-UK stock buys currently open, with a signal strength of 89 out of 100.
This week's summary
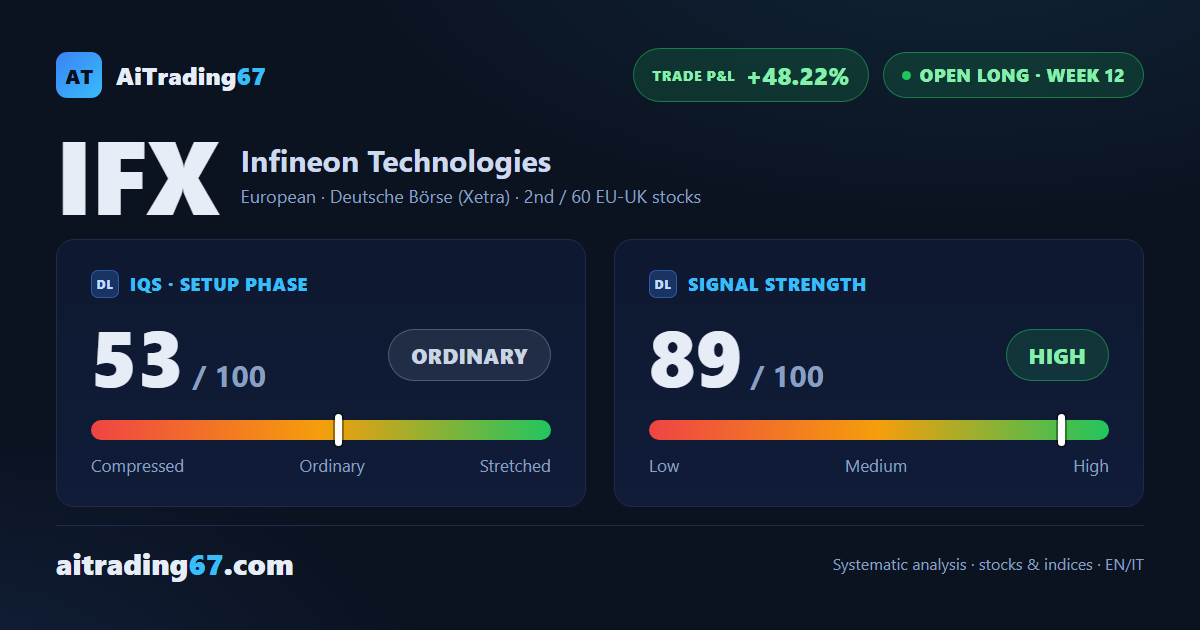
Infineon slips 6.3% this week, the third straight down week after the strong summer run, and the price retests the 72 area, where a clean double bottom already produced a 26% rebound just days ago. The weekly structure stays intact - moving averages aligned, price above the Ichimoku cloud - but money flow has nearly halved over the past month. The trade, open for 12 weeks, is still up 48%.
IQS Phase
53
ordinary
Signal Strength
89
high · wide & volatile
Sizing
FULL
Ranking
#2 / 60
EU-UK stocks in progress
Trade P&L %
+48.22%
from signal to today
restricted Platinum content