
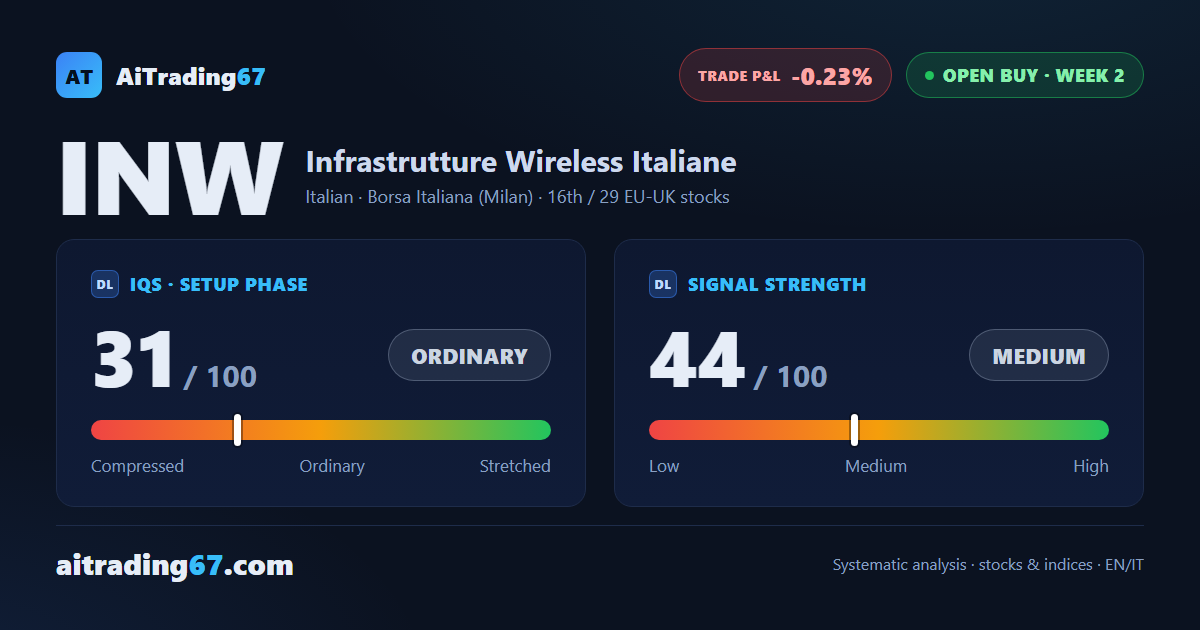
Buy signal in week 2, confirmation missed
INWIT flat at 0.0%: the week touches the 20-week average and closes below it
Our view last week
A mixed week for INWIT stock: the weekly bar closes at -0.2%, indecisive, with sellers dominating to an extreme and buying below 25% of volume. On the daily chart, by contrast, the lows have kept rising since early September. The buy signal that fired a week ago finds no confirmation, and the system issues an early-exit warning. Price action calls for caution: the stock is still below the 20-week average, in the 6.6 area.
This week's summary
A flat week at 0.0% only on the surface: price climbed to the 20-week moving average, in the 6.6 area, and closed below it again. INWIT stock sits where it was 7 days ago, with contracting volumes and money flow negative for 18 weeks. The buy signal that fired 2 weeks ago has found no confirmation, and the early-exit warning still stands. On the daily chart the move continues for now: for this technical analysis the test is the 7-day high.
IQS Phase
31
ordinary
Signal Strength
44
medium · weak
Sizing
REDUCED
Ranking
#16 / 29
EU-UK stocks in progress
Trade P&L %
-0.23%
from signal to date, no stop loss
INWIT (INW) weekly chart — EMA50 · MACD · VWAP
Weekly chart · EMA50 · MACD · VWAP · Source: TradingView
Rank position
ranks 16th among the 29 Longs already running for European-UK stocks in our ranking, with a signal strength of 44 out of 100.
Sector context
SectorItalian
Benchmark ETFEXV2
Sector regimeweak phase
Performanceweekly -0.85% · monthly -2.51%
INW belongs to the italian sector (reference ETF EXV2). The sector is classified weak phase according to our weekly reading.
restricted Platinum content