EN IT

Intel: the dip was a trap. Now the trend resumes with strength

Intel weekly technical analysis — week 23 of a long trade setup, +194% performance. Model coverage complete, trailing stop active. After a May pullback, the stock rebounded with strong buy volume and positive CMF for the past 2 weeks.

Intel: the dip was a trap. Now the trend resumes with strength
Intel · +194% trade, model coverage complete
Intel: the dip was a trap. Now the trend resumes with strength
June 19, 2026
Intel · +194% trade, model coverage complete
In Summary
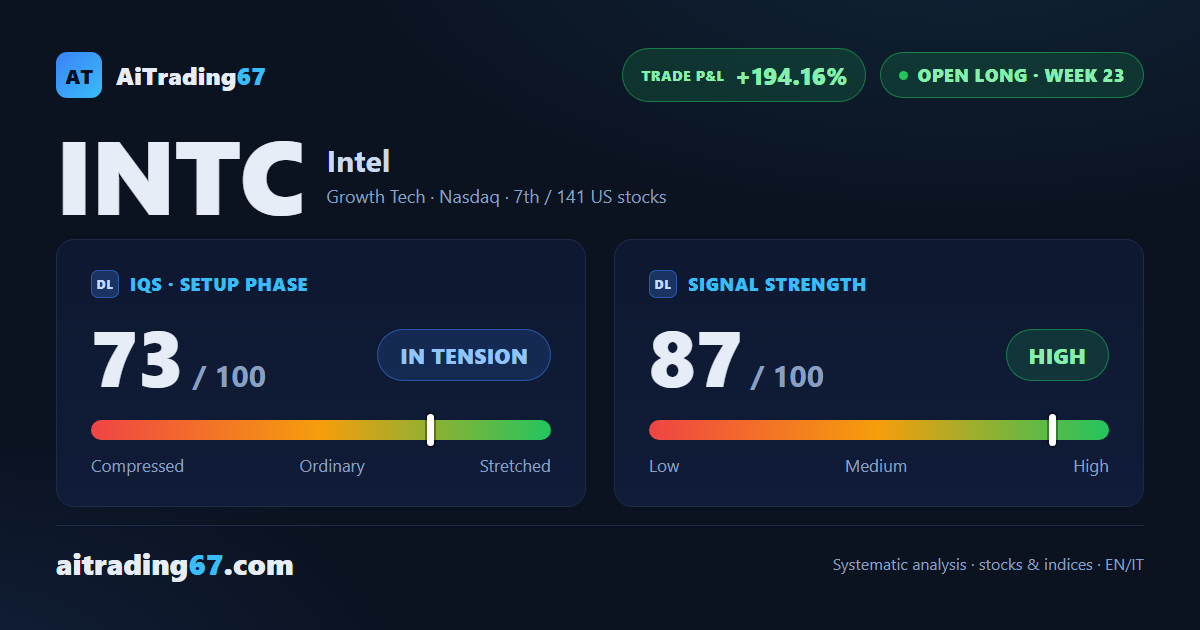
Intel is at week 23 of a long trade showing +194% from entry. Model coverage is complete: the 3 time windows have passed and the stop now trails the Inversion Point in the 104 area, protecting the accumulated gain. After a sharp pullback in May, the last 2 weeks showed a decisive recovery with dominant buy volume.
Open long ·23rd week from start ·US stocks ·T1 ★ See Gold version →
IQS Phase
73
in tension
Signal Strength
87
high · wide & volatile
Sizing
FULL
Ranking
#7 / 141
US stocks in progress
Trade P&L %
+194.16%
from signal to today
Chart · Weekly — EMA50 · MACD · VWAP
Weekly chart · EMA50 · MACD · VWAP · Source: TradingView
How to read this pageA visual guide to the post, card by card
The full analysis, operating plan and detailed levels on this asset are reserved for clients ★ PLATINUM
restricted Platinum content
Share WhatsApp Telegram Gmail LinkedIn