
Intel's buy trade hits a third rough week
Intel slips 8.7% in its third down week as the rally tests two key averages
Intel's buy trade hits a third rough week
Our view last week
Intel is in week 25 of a buy signal and has already cleared every stage of the model: all 3 price targets have been hit and coverage is complete. The trade is up 164% since entry, with the stop now anchored to the Inversion Point. On the technical side, the week just closed was one of cooling off, not a break: the rally holds, but with less drive.
This week's summary
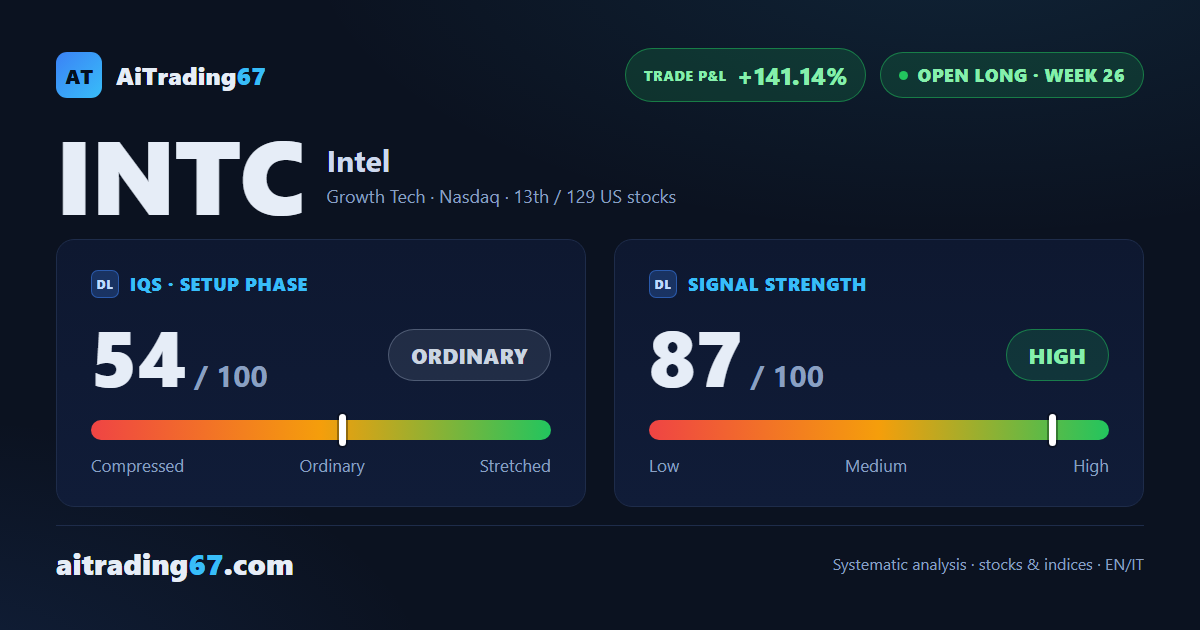
Intel has closed its third straight down week, shedding 8.7%: the rally is losing steam faster than it looked a week ago. Money flow turned negative for the first time in a month and momentum has caved in, while the price stays boxed between the 50-day average, in the 111 area, and the pivot average, in the 109 area. The trade's gain has slipped to 141% since entry, down from 164% last week.
IQS Phase
54
ordinary
Signal Strength
87
high · wide & volatile
Sizing
FULL
Ranking
#13 / 129
US stocks in progress
Trade P&L %
+141.14%
from signal to today
restricted Platinum content