
Intel: double bottom, sellers strike back
Intel drops 2.9%: double bottom holds, but sellers strike back
Intel: double bottom, sellers strike back
Our view last week
Intel shares slide 13.5% in a single week, and our model opens a fresh Sell signal, straight into 10th place among the 140 US stock sell signals. Signal strength maxes out at 100 out of 100, reading "downtrend making lower lows, pace holding" - a healthy decline still running. The daily chart, though, shows a double bottom in the 97 area with a 49% intermediate rebound, and earnings land this very week: Intel technical analysis worth watching closely.
This week's summary
Intel drops 2.9% as its Sell signal moves into confirmation week. The daily chart's clean double bottom in the 91 area had sparked a 19% rebound, but the last session flipped the tone: sellers came back in force and the stock slid into distribution. Intel's price action stays trapped between the 100-day moving average in the 94 area and the daily cloud floor in the 91 area.
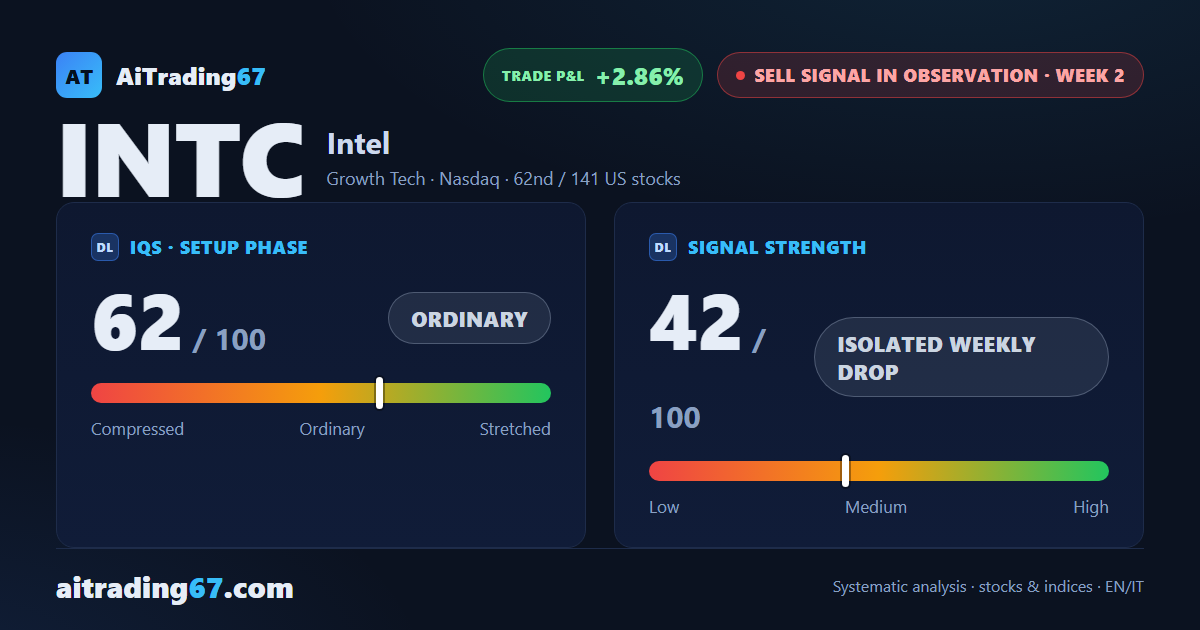
Sell signal in observation
·2nd week from start
·US stocks
·T2
·📅 Earnings · Jul 23
★ See Gold version →
IQS Phase
62
ordinary
Signal Strength
42
isolated weekly drop
Sizing
REDUCED
Ranking
#62 / 141
US stocks sell signals
Trade P&L %
+2.86%
from signal to today
Rank position
ranks 62nd among the 141 sell signals for US stocks in our ranking, with a signal strength of 42 out of 100.
Sector context
SectorGrowth Tech
Benchmark ETFXLK
Sector regimeweak phase
Performanceweekly +0.17% · monthly -3.92%
INTC belongs to the growth tech sector (reference ETF XLK). The sector is classified weak phase according to our weekly reading.
restricted Platinum content