
Sell signal in confirmation week
Intel drops 2.3% as the run of lower highs extends on the daily chart
Sell signal in confirmation week
Our view last week
Intel drops 2.9% as its Sell signal moves into confirmation week. The daily chart's clean double bottom in the 91 area had sparked a 19% rebound, but the last session flipped the tone: sellers came back in force and the stock slid into distribution. Intel's price action stays trapped between the 100-day moving average in the 94 area and the daily cloud floor in the 91 area.
This week's summary
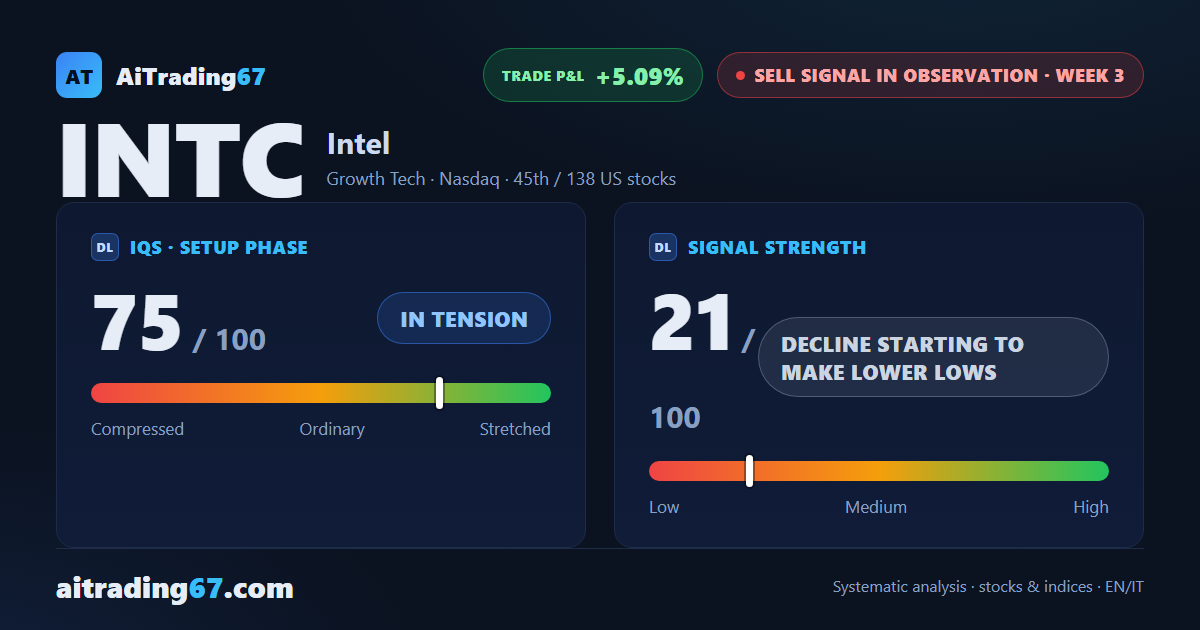
Intel slides another 2.3% as the distribution phase flagged last week widens: on the daily chart sellers control nearly all the volume and cash flow stays negative. A run of 3 lower highs has formed, from the 117 area toward the 107 area - the rebound sparked by last week's double bottom has faded without reclaiming the 100-day moving average in the 94 area. The sell signal remains in its confirmation week.
IQS Phase
75
in tension
Signal Strength
21
decline starting to make lower lows
Sizing
MINIMUM
Ranking
#45 / 138
US stocks sell signals
Trade P&L %
+5.09%
from signal to date, no stop loss
Rank position
ranks 45th among the 138 sell signals for US stocks in our ranking, with a signal strength of 21 out of 100.
Sector context
SectorGrowth Tech
Benchmark ETFXLK
Sector regimeweak phase
Performanceweekly -0.30% · monthly -5.53%
INTC belongs to the growth tech sector (reference ETF XLK). The sector is classified weak phase according to our weekly reading.
restricted Platinum content