
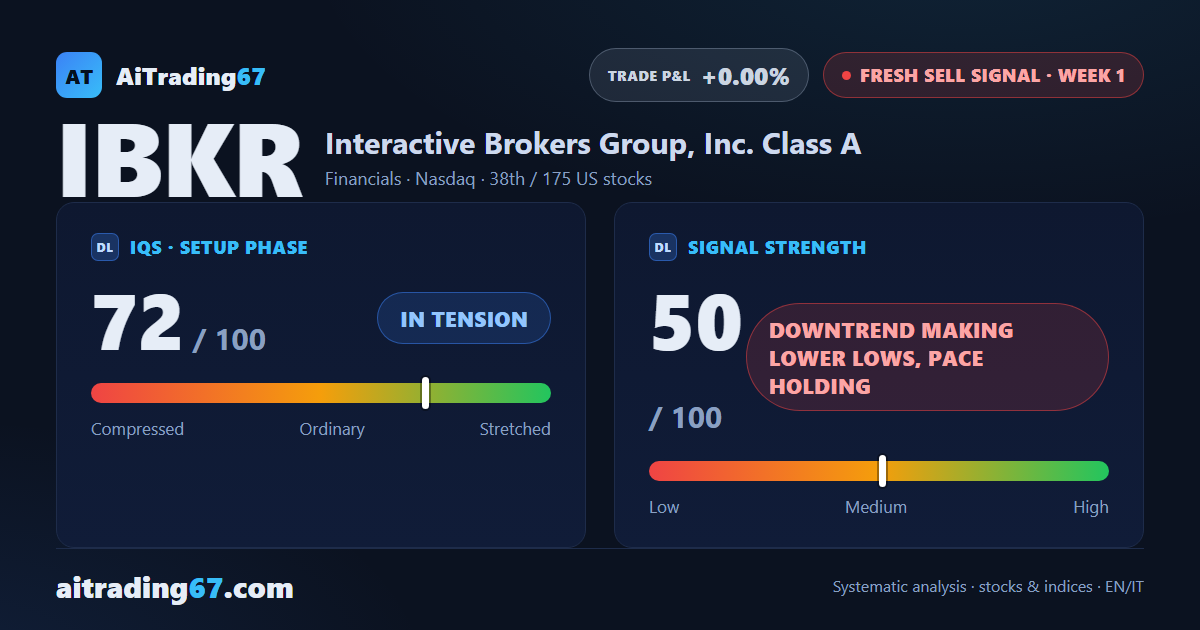
Fresh sell signal · US stocks
Interactive Brokers slips 1.1%, a 5th straight weekly drop, and a Sell signal fires
Our view last week
Last week's divergence has resolved to the downside: after 7 days with 94% of volume on the buy side, the weekly bar flips to 87% selling and the price slips 1.6%, a 4th straight losing week. Interactive Brokers stock still trades above its 50-week average and money flow is still positive, yet the MACD stays under its Signal line and a falling ADX says the trend is losing conviction: price action trading calls for attention here.
This week's summary
A 5th straight weekly decline and a close below the 20-week average: a fresh Sell signal has fired on Interactive Brokers. Last week the trend was losing conviction, now the model takes note. Interactive Brokers stock still holds above its 50-week average and weekly money flow is still positive: on our technical analysis, opening a short here is high-risk, and with earnings on October 15 this is one of the US stocks to watch.
IQS Phase
72
in tension
Signal Strength
50
downtrend making lower lows, pace holding
Sizing
STANDARD
Ranking
#38 / 175
New us stocks
Trade P&L %
+0.00%
from signal to date, no stop loss
Interactive Brokers (IBKR) weekly chart — EMA50 · MACD · VWAP
Weekly chart · EMA50 · MACD · VWAP · Source: TradingView
Rank position
ranks 38th among the 175 sell signals for US stocks in our ranking, with a signal strength of 50 out of 100.
Sector context
SectorFinancials
Benchmark ETFXLF
Sector regimeweak phase
Performanceweekly -2.46% · monthly -7.23%
IBKR belongs to the financials sector (reference ETF XLF). The sector is classified weak phase according to our weekly reading.
restricted Platinum content