
Open buy, week 5: lower highs on the daily chart
IBM slips 1.3% as the 200-week average holds through a third straight drop
Our view last week
Sellers are in charge for a second straight week: IBM slips 1.8%, with buying below 25% of volume in the weekly bar, and leans on its 7-day low, in the 225.2 area. The drop is slowing after last week's -5.6%, and weekly money flow turns positive after 11 weeks. IBM stock technical analysis shows one of the weekly buy signals among tech stocks under strain, 4.3% below entry: a swing trading case that calls for discipline.
This week's summary
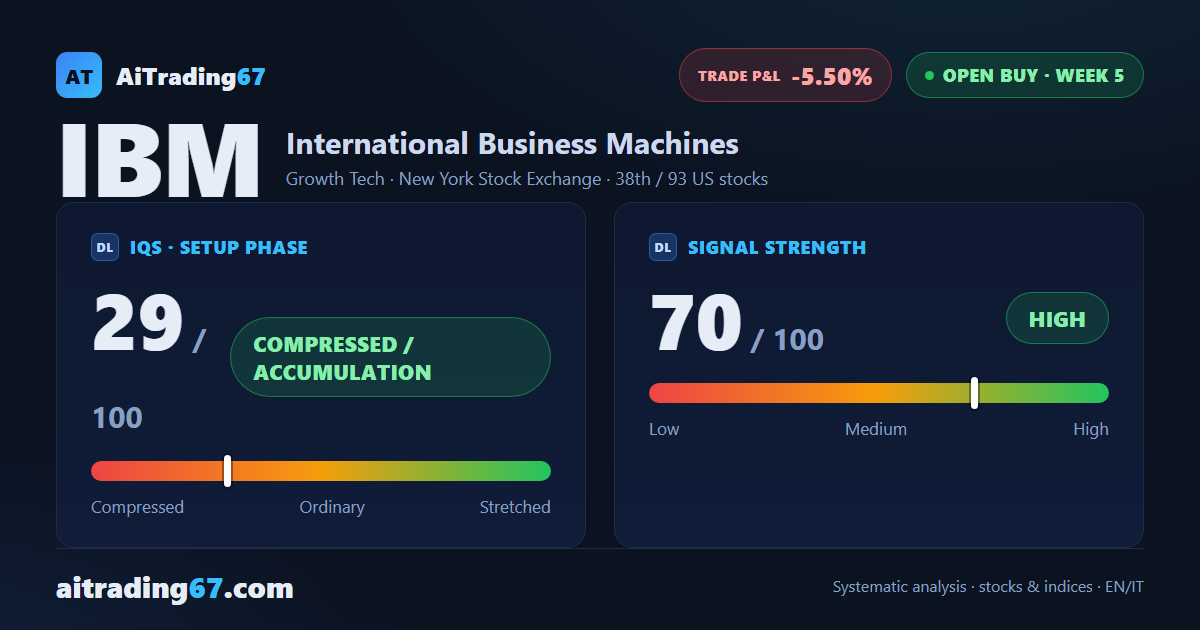
A third straight weekly drop for IBM, down 1.3% and reaching its 200-week average, in the 220 area, without losing it on the close. Money flow, which had turned positive a week ago, is negative again, and the daily chart shows 4 lower highs. IBM stock technical analysis reads one of the weekly buy signals among tech stocks under strain, 5.5% below entry while the tech sector rises: a case that calls for caution, with earnings on October 21 approaching.
IQS Phase
29
compressed / accumulation
Signal Strength
70
high · wide & volatile
Sizing
FULL
Ranking
#38 / 93
US stocks in progress
Trade P&L %
-5.50%
from signal to date, no stop loss
Rank position
ranks 38th among the 93 Longs already running for US stocks in our ranking, with a signal strength of 70 out of 100.
Sector context
SectorGrowth Tech
Benchmark ETFXLK
Sector regimein strong phase
Performanceweekly +1.80% · monthly +8.83%
IBM belongs to the growth tech sector (reference ETF XLK). The sector is classified in strong phase according to our weekly reading.
restricted Platinum content