
EN IT

Intuit: decline loses momentum, structure holds

Intuit weekly technical analysis — week 11 of a sell setup, +23.7% performance since entry. The decline has slowed but the bear structure holds. New entries not recommended per our model.

Intuit: decline loses momentum, structure holds
Sell signal · week 11
Intuit: decline loses momentum, structure holds
June 26, 2026
Sell signal · week 11
In Summary
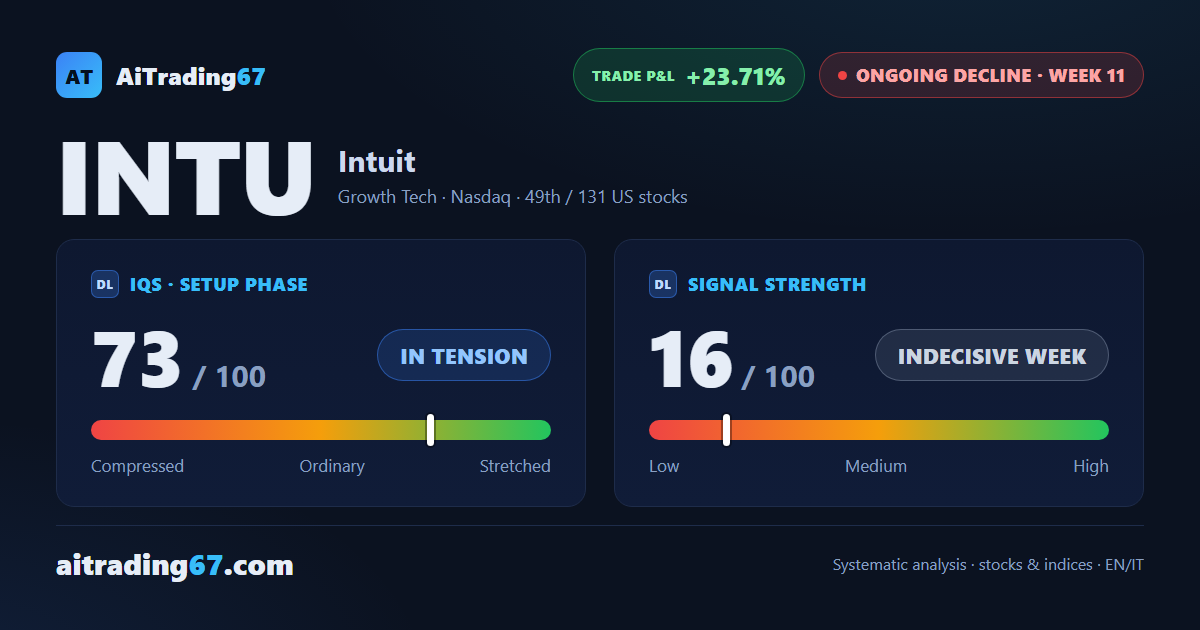
Intuit is in week 11 of a sell signal, with the trade up 23.7% from entry. The latest week closed nearly flat (+0.3%), with buy volume surging to 81% — a pause, not a reversal. The bear structure remains intact, and our model flags new short entries as not recommended at current risk levels.
Ongoing decline ·11th week from start ·US stocks ·T2 ★ See Gold version →
IQS Phase
73
in tension
Signal Strength
16
indecisive week
Sizing
MINIMUM
Ranking
#49 / 131
US stocks
Trade P&L %
+23.71%
from signal to today
Chart · Weekly — EMA50 · MACD · VWAP
Weekly chart · EMA50 · MACD · VWAP · Source: TradingView
How to read this pageA visual guide to the post, card by card
The full analysis, operating plan and detailed levels on this asset are reserved for clients ★ PLATINUM
restricted Platinum content
Share WhatsApp Telegram Gmail LinkedIn