
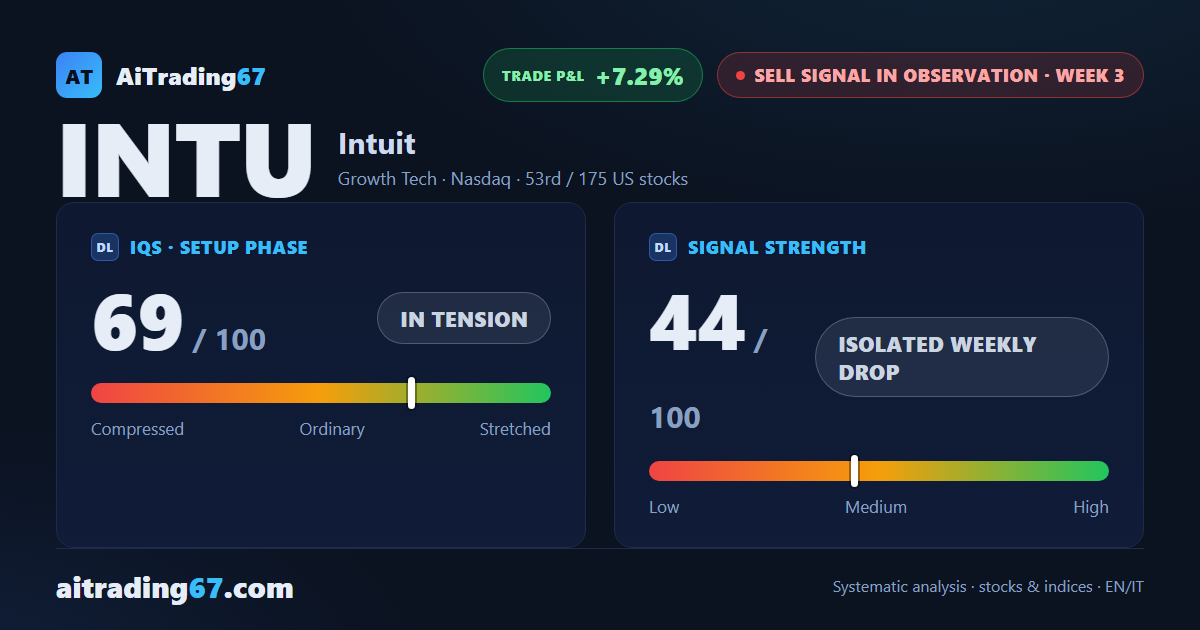
Sell signal in observation · week 3
Intuit gains 1.9% as a fresh 30-day low fails to hold on the weekly close
Our view last week
A week closed at -9%, with price action that leaves little doubt: buying below 25% of volume and sellers extremely dominant. On the daily chart the lower highs now number 4, the latest in the 311 area, and signal strength climbs from 77 to 100 out of 100. This Intuit stock technical analysis sees the sell signal confirmed in its second week, among US tech stocks, while our model still rates opening a fresh short as high-risk.
This week's summary
Intuit printed a fresh 30-day low this week, in the 262 area, and failed to confirm it on the close: the week ends up 1.9%, breaking a run of 5 straight declines. After last week's 9% drop the push behind the decline has cooled, and the daily price action still shows 3 lower highs. Among US tech stocks, Intuit stock keeps its sell signal in observation in this technical analysis, and our model still rates a fresh short as high-risk: a trade setup to follow week by week.
IQS Phase
69
in tension
Signal Strength
44
isolated weekly drop
Sizing
REDUCED
Ranking
#53 / 175
US stocks sell signals
Trade P&L %
+7.29%
from signal to date, no stop loss
Intuit (INTU) weekly chart — EMA50 · MACD · VWAP
Weekly chart · EMA50 · MACD · VWAP · Source: TradingView
Rank position
ranks 53rd among the 175 sell signals for US stocks in our ranking, with a signal strength of 44 out of 100.
Sector context
SectorGrowth Tech
Benchmark ETFXLK
Sector regimein strong phase
Performanceweekly +1.80% · monthly +8.83%
INTU belongs to the growth tech sector (reference ETF XLK). The sector is classified in strong phase according to our weekly reading.
restricted Platinum content