
IonQ: the decline keeps pushing
IonQ stock drops 18.9% as the Sell signal climbs to 11th among US setups
IonQ: the decline keeps pushing
Our view last week
IonQ stock shed 12.7% in a turning-point week: after a nearly flat pause, sellers came back in full control, with a distribution phase now in full swing. The sell signal climbs from 114th to 11th among the 137 US sell setups, with signal strength back to reading "downtrend starting to make lower lows".
This week's summary
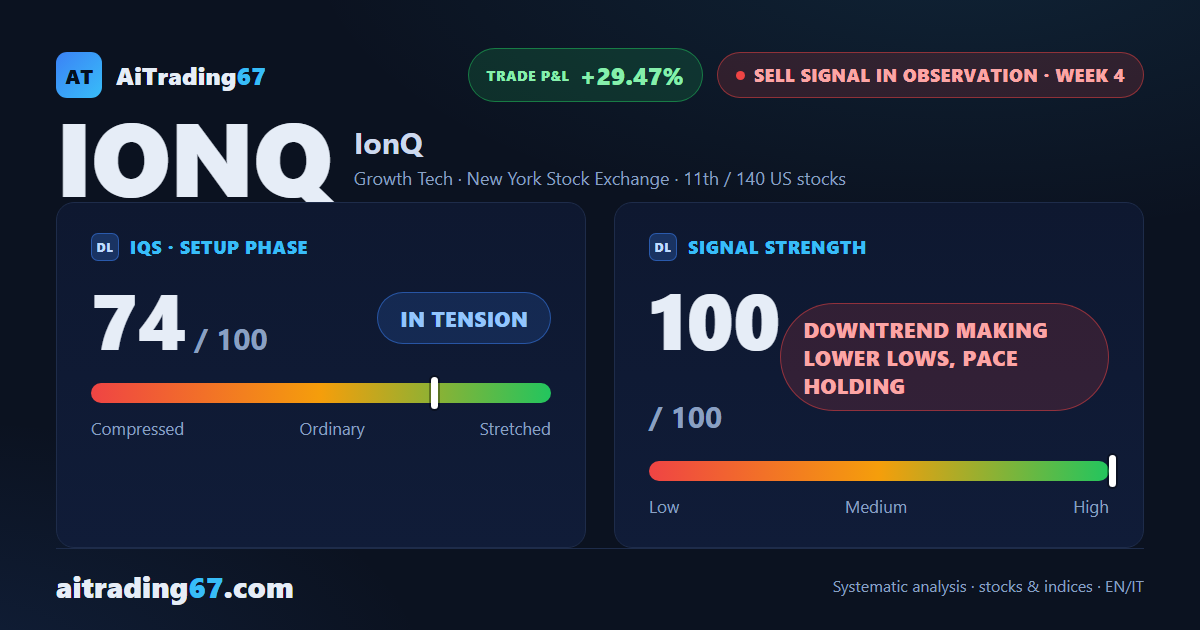
IonQ stock shed another 18.9% this week, with sellers nearly in full control of the last bar and the distribution phase deepening: volumes contracting and buyer dominance collapsing. After last week's plunge, the decline shows no sign of slowing — the Sell signal climbs to 11th among the 140 US sell setups, with signal strength maxed out at 100 out of 100, reading "downtrend making lower lows, pace holding". The quality band flags trading as not recommended.
Sell signal in observation
·4th week from start
·US stocks
·T2
·📅 Earnings · Aug 12
★ See Gold version →
IQS Phase
74
in tension
Signal Strength
100
downtrend making lower lows, pace holding
Sizing
STANDARD
Ranking
#11 / 140
US stocks sell signals
Trade P&L %
+29.47%
from signal to today
restricted Platinum content