
Iridium, second week in the red
Iridium sheds 6.8% in its second week as the buy signal stays under review
Iridium, second week in the red
Our view last week
Iridium closed its first week since entry with a 6.9% drop, after the surge that made it last week's strongest fresh buy signal. Sellers took clear control on the last bar, and price now works in a tight band between the daily pivot average just above and its moving average just below. Signal strength holds high, at 74 out of 100: here it speaks to size and volatility, and this technical analysis setup calls for discipline.
This week's summary
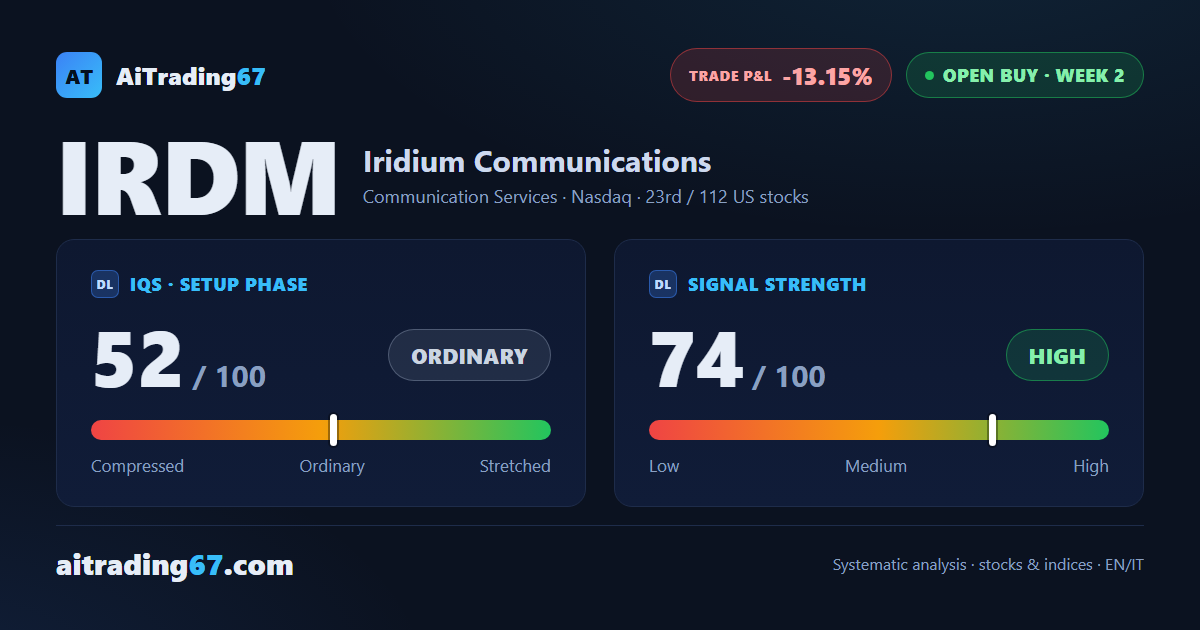
Iridium's buy signal reaches its second week with another decline, down 6.8%, and the trade slips to a 13% loss since entry. Price stays boxed between the daily Kumo ceiling and the 50-day moving average, with sellers back in control on the last bar. Signal strength holds high, at 74 out of 100: here it's size and volatility, not directional confirmation, and the stop has already tightened to protect capital. This swing trading setup calls for a moment of caution, with earnings due in two weeks.
IQS Phase
52
ordinary
Signal Strength
74
high · wide & volatile
Sizing
FULL
Ranking
#23 / 112
US stocks in progress
Trade P&L %
-13.15%
from signal to today
restricted Platinum content