
US stocks · sell signal, week 11
Iridium adds 0.4% as money flow climbs to its highest reading in 4 weeks
Our view last week
A turning week on the tape for Iridium stock: up 4.2%, with 77% of volume on the buy side against 41% seven days ago, and money flow back in positive territory after 10 weeks below zero. Our technical analysis shows a sell signal losing its grip: the MACD is still under its Signal line, the histogram is rising and the price action is indecisive. The price is working just under the Inversion Point, in the 50 area.
This week's summary
A second straight weekly gain for Iridium, up 0.4%, with weekly money flow at its highest reading in 4 weeks and momentum back above zero. Last week was the turn, this week the follow-through. Our technical analysis of Iridium stock shows a sell signal losing its grip: the MACD is still under its Signal line, but the histogram is rising and the ADX keeps falling. The price is working right up against the Inversion Point, with earnings due on October 15.
IQS Phase
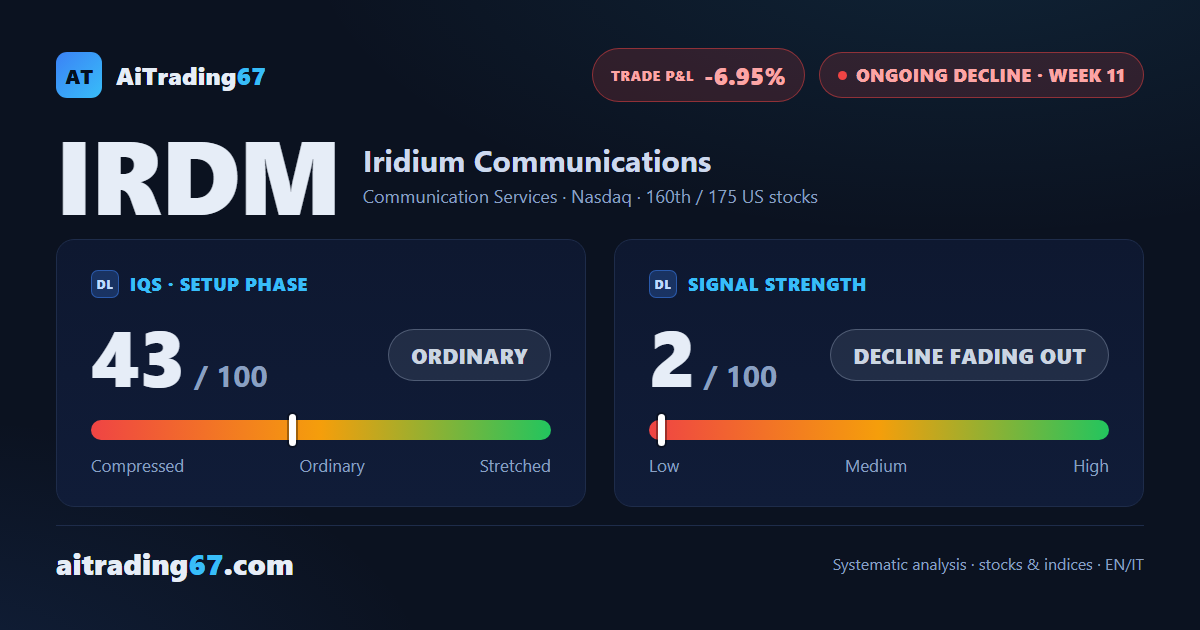
43
ordinary
Signal Strength
2
decline fading out
Sizing
MINIMUM
Ranking
#160 / 175
US stocks
Trade P&L %
-6.95%
from signal to date, no stop loss
Iridium Communications (IRDM) weekly chart — EMA50 · MACD · VWAP
Weekly chart · EMA50 · MACD · VWAP · Source: TradingView
Rank position
ranks 160th among the 175 sell signals for US stocks in our ranking, with a signal strength of 2 out of 100.
Sector context
SectorCommunication Services
Benchmark ETFXLC
Sector regimein positive regime
Performanceweekly -2.34% · monthly -1.87%
IRDM belongs to the communication services sector (reference ETF XLC). The sector is classified in positive regime according to our weekly reading.
restricted Platinum content