
The ISF, an ETF tracking the FTSE 100 · buy signal stalling, 12% below records
ISF (FTSE 100): weak uptrend and a double bottom in the 1000 area, thrust missing
The ISF, an ETF tracking the FTSE 100 · buy signal stalling, 12% below records
Our view last week
The FTSE 100 is in week 12 of an open buy signal, with the position essentially flat since entry. The weekly structure remains aligned to the upside and price is working around 10% below the all-time high, but the picture is losing thrust: Signal Strength drops to 11 out of 100 and is fading, while the quality band flags an inadvisable new entry. Two of the three scale-out windows have already passed.
This week's summary
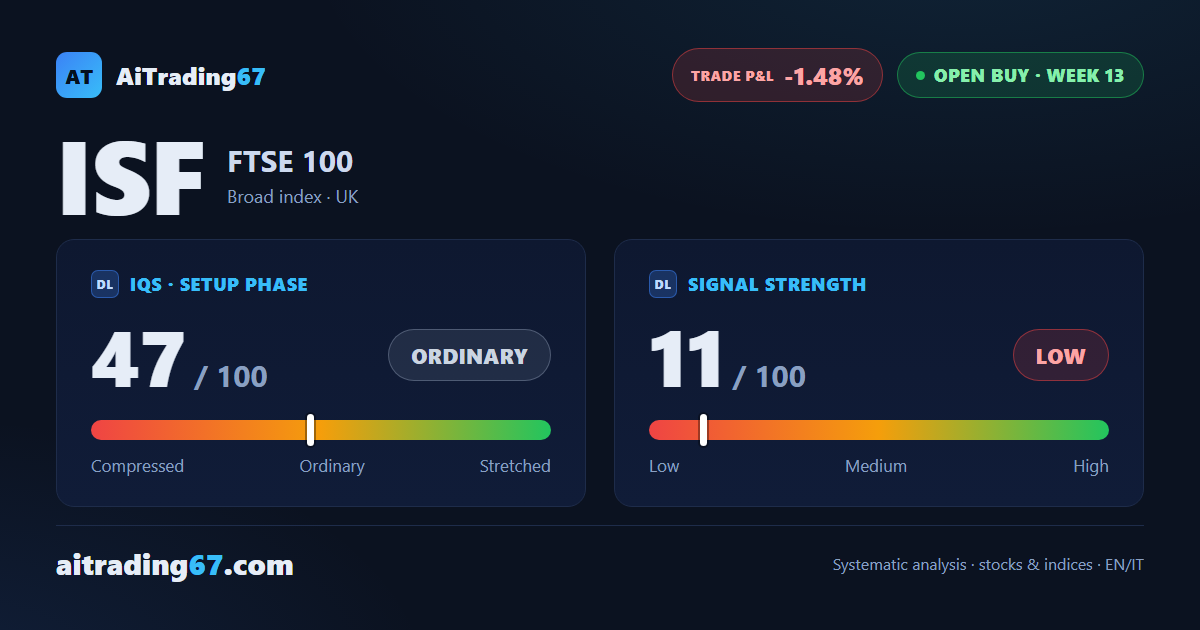
The ISF, an ETF tracking the FTSE 100, is working more than 12% below its all-time high, with wide room to run and a double bottom just drawn in the 1000 area. Weekly technical analysis stays cautious, though: after 13 weeks the buy signal is slightly underwater, Signal Strength is low and fading, and the quality band advises against fresh entries. The structure holds while momentum dulls — a weak uptrend to walk along with the stop.
IQS Phase
47
ordinary
Signal Strength
11
low · fading
ATH distance
12.19%
12.19%
KPI 4
0/3
Trade P&L %
-1.48%
from signal to today
restricted Platinum content