
FTSE 100: a stalled buy with wide room ahead
ISF (FTSE 100): technical analysis of a stalled buy with room to the highs
FTSE 100: a stalled buy with wide room ahead
Our view last week
The ISF, an ETF tracking the FTSE 100, is working more than 12% below its all-time high, with wide room to run and a double bottom just drawn in the 1000 area. Weekly technical analysis stays cautious, though: after 13 weeks the buy signal is slightly underwater, Signal Strength is low and fading, and the quality band advises against fresh entries. The structure holds while momentum dulls — a weak uptrend to walk along with the stop.
This week's summary
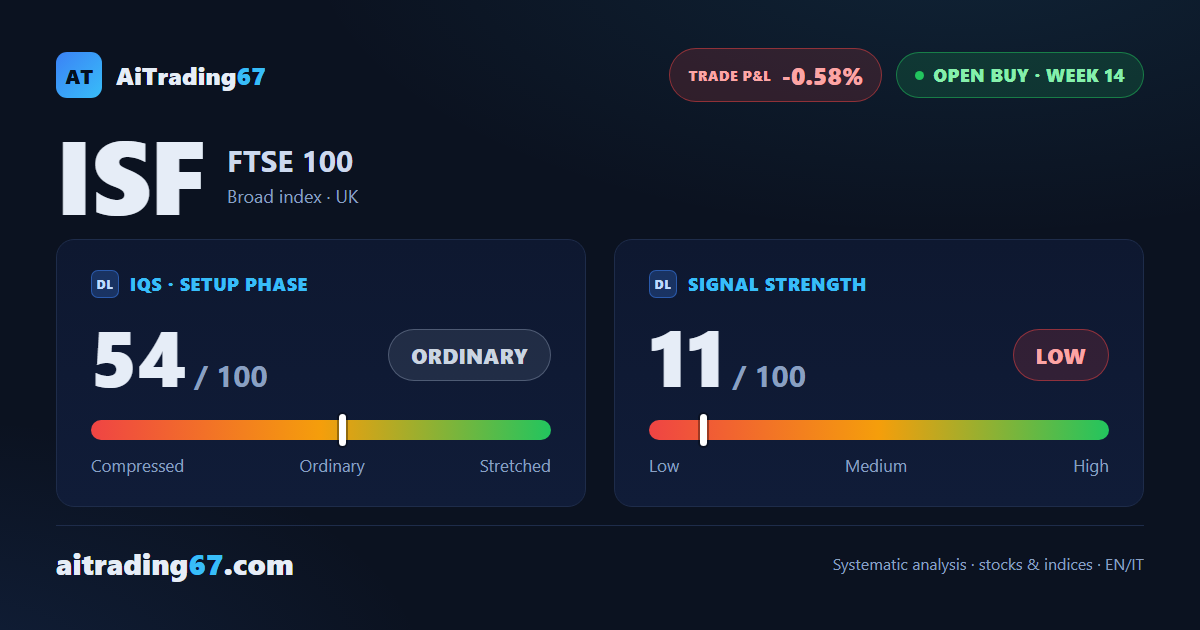
The ISF, an ETF tracking the FTSE 100, is working more than 11% below its all-time high: wide room to run and a fresh double bottom just drawn in the 1000 area. The buy signal, though, has stalled — 14 weeks in and marginally below the entry price — with Signal Strength low and fading and the quality band advising against fresh entries. On the daily, buyers stay active; on the weekly, the drive dulls: an uptrend to walk along with the stop.
IQS Phase
54
ordinary
Signal Strength
11
low · fading
ATH distance
11.17%
11.17%
KPI 4
0/3
Trade P&L %
-0.58%
from signal to today
restricted Platinum content