
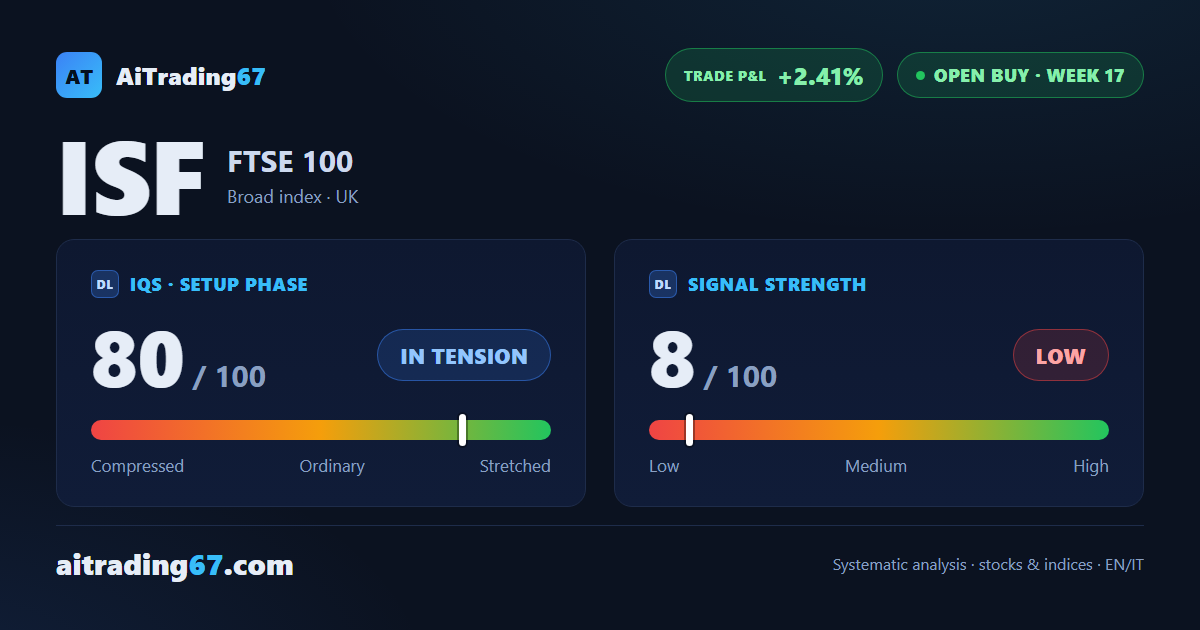
Open buy · week 17 · +2.41%
ISF, the FTSE 100 ETF: a fifth higher low with the record 8% away
Open buy · week 17 · +2.41%
Our view last week
Weekly technical analysis of ISF, the FTSE 100 ETF: the MACD crosses higher, the histogram is back above zero after four weeks of recovery, and ADX at 37.2 speaks of a trend with conviction. On the daily, four higher lows carry price from the 1010 handle toward 1030, with the record still 8.44% above. But buying, overwhelming seven days ago, is now a quarter of turnover. The quality band still advises against new entries.
This week's summary
Weekly technical analysis of ISF, the FTSE 100 ETF: on the daily a fifth higher low walks price back toward the recent high, while the weekly MACD, below zero a month ago, is now firmly positive with ADX above 37. The record still stands 7.93% higher and buying is worth less than a third of turnover: Signal Strength sits at 8 out of 100 and the quality band advises against fresh entries. The trade is up 2.41%.
IQS Phase
80
in tension
Signal Strength
8
low · fading
ATH distance
7.93%
7.93%
KPI 4
0/3
Trade P&L %
+2.41%
from signal to date, no stop loss
restricted Platinum content