
Buyers still in control, but cracks to watch
Intesa Sanpaolo rises 1.5% with a bounce off its 20-day moving average
Buyers still in control, but cracks to watch
Our view last week
Intesa Sanpaolo is in week 12 of a buy signal, and the model's coverage is now closed: all 3 reference targets of our most advanced model have been hit, the stop now trails the Inversion Point, in the 5.7 area. The accumulated gain stands at 9.03%. On the technical side, the week just closed was one of recovery, though with a few cracks worth watching.
This week's summary
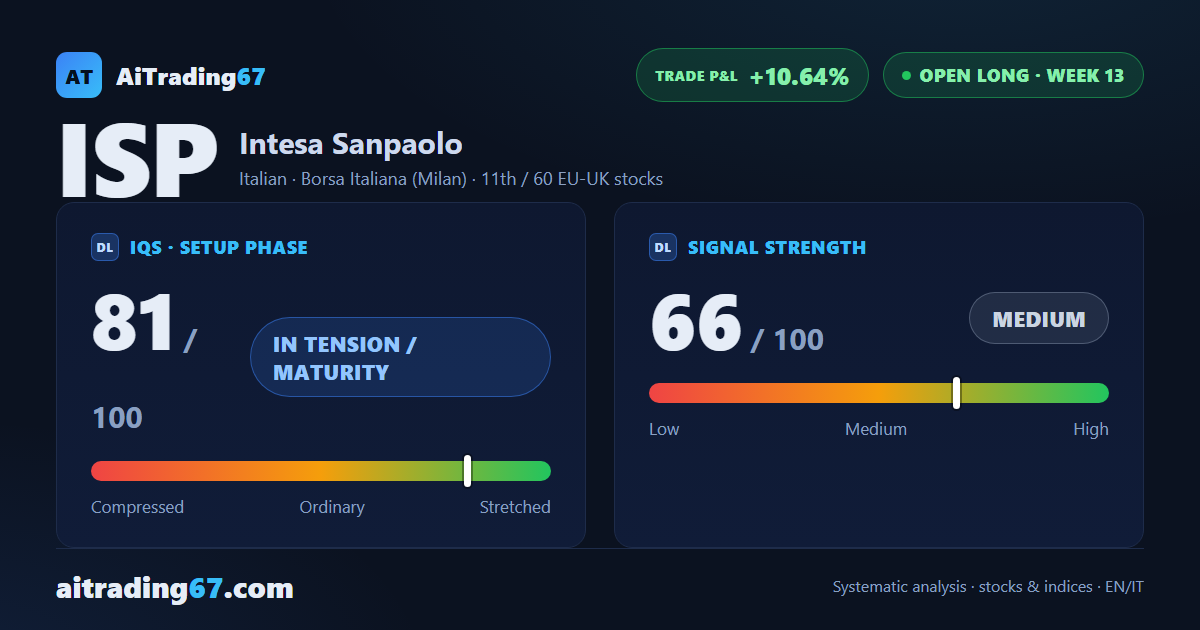
Intesa Sanpaolo shares push back toward the highs in this week's technical analysis: the stock bounced 4% off its own 20-day moving average, with buyers still firmly in control. The same cracks from last week are still open — volumes are contracting and the latest candle confirms fading body conviction. The trade, now in its 13th week, is up 10.64% from entry.
Open long
·13th week from start
·EU-UK stocks
·T1 Featured
·📅 Earnings · Jul 29
★ See Gold version →
IQS Phase
81
in tension / maturity
Signal Strength
66
medium
Sizing
STANDARD
Ranking
#11 / 60
EU-UK stocks in progress
Trade P&L %
+10.64%
from signal to today
restricted Platinum content