
ITOT: sellers retake control
ITOT slips 1.5% as sellers retake control, trade still up 9.65%
ITOT: sellers retake control
Our view last week
This week's technical analysis on ITOT tells a clean change of hands: buyers are back in control of 97% of trading, after a session two weeks ago that saw sellers hold 80% of volume, confirming the 5% rebound off the double bottom in the 159 area. The fund stays glued to its record highs, just 0.53 percentage points away — a level already tested 6 times over the last 10 weeks — while underneath, momentum keeps fading week after week.
This week's summary
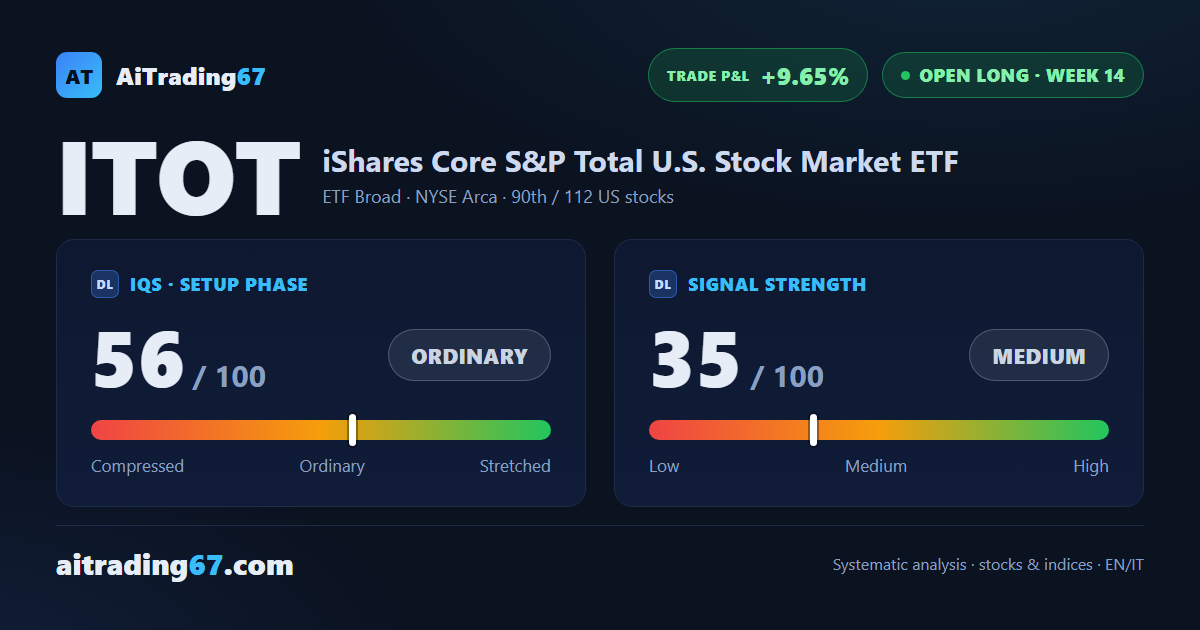
This week's ITOT technical analysis tells of another change of hands: after buyers dominated trading 7 days ago, sellers took back control, running 82% of volume and pulling the price down 1.5%. The fund still sits glued to its record highs, just 2% below, a level already tested 7 times over the last 10 weeks, while underneath, momentum keeps fading. The buy signal, running for 14 weeks, stays up 9.65%.
IQS Phase
56
ordinary
Signal Strength
35
medium · weak
Sizing
REDUCED
Ranking
#90 / 112
US stocks in progress
Trade P&L %
+9.65%
from signal to today
restricted Platinum content