
IWB cools at the edge of the No-Trade Zone
IWB slips 1.5% as the bounce loses steam near its highs
IWB cools at the edge of the No-Trade Zone
Our view last week
iShares Russell 1000 ETF closed the week up 1.1%, with buyers dominating 97% of the volume — the most lopsided reading of the past four weeks. Overall volume, though, keeps shrinking, the same flag raised last week. Price is boxed into a very tight corridor, between the 7-day-high resistance (413 area) and the support just below (412 area): underlying momentum, meanwhile, is cooling.
This week's summary
This week IWB gave back 1.5%, with sellers making up 85% of the volume — a sharp reversal from last week, when buyers had dominated 97% of the tape. Price slipped toward the lower edge of the No-Trade Zone, in the 406 area, while momentum keeps cooling: MACD and its histogram have faded for a fourth straight week. In the background sits the double bottom in the 397 area, with a 4% rebound.
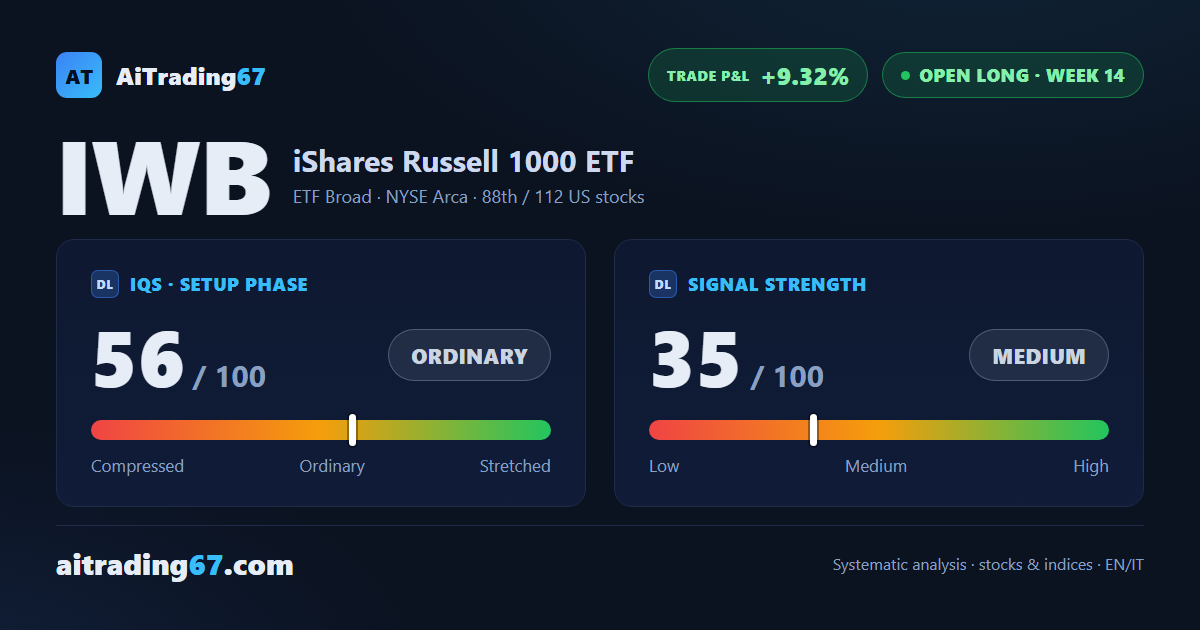
IQS Phase
56
ordinary
Signal Strength
35
medium · weak
Sizing
REDUCED
Ranking
#88 / 112
US stocks in progress
Trade P&L %
+9.32%
from signal to today
restricted Platinum content