
IWB: the rally loses steam, a fourth week of cooling
IWB slips 0.6% as momentum fades for a fourth straight week
IWB: the rally loses steam, a fourth week of cooling
Our view last week
This week IWB gave back 1.5%, with sellers making up 85% of the volume — a sharp reversal from last week, when buyers had dominated 97% of the tape. Price slipped toward the lower edge of the No-Trade Zone, in the 406 area, while momentum keeps cooling: MACD and its histogram have faded for a fourth straight week. In the background sits the double bottom in the 397 area, with a 4% rebound.
This week's summary
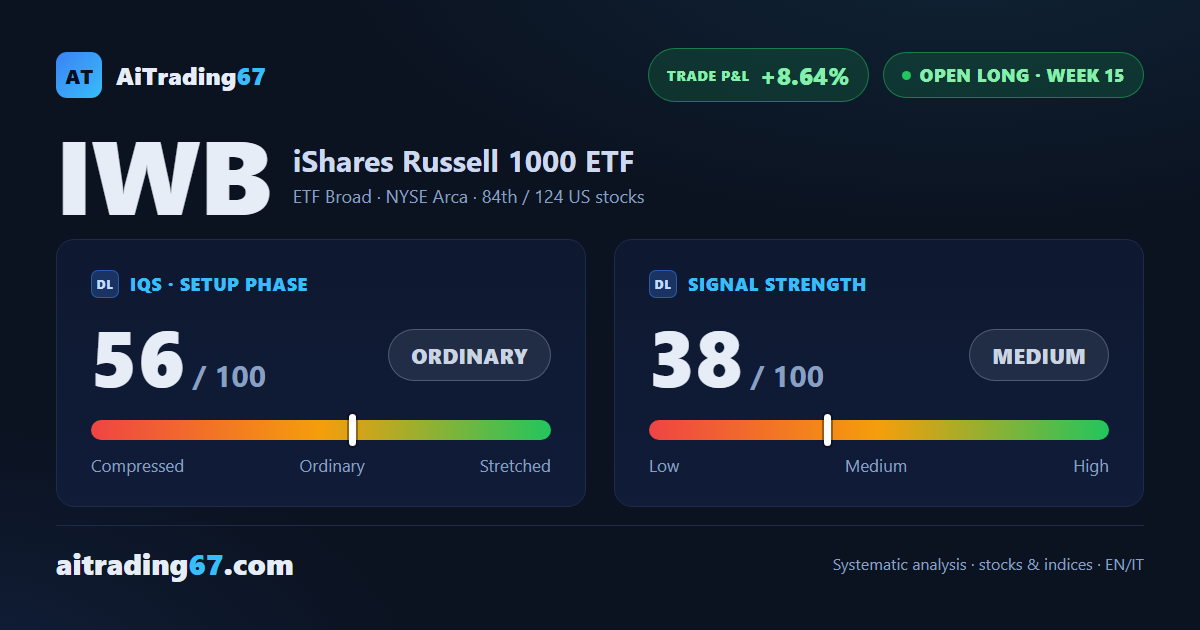
IWB, the US large-cap ETF tracking the Russell 1000, closes a fourth straight week of cooling momentum: the weekly MACD histogram, fading for a month, has nearly flattened to zero. Sellers stay dominant at 75% of volume, though down from 85% last week. This IWB technical analysis shows price boxed between the 50-day moving average, in the 404 area, and the daily Bollinger Band, in the 402 area, with the trade still up 8.6% since entry.
IQS Phase
56
ordinary
Signal Strength
38
medium · weak
Sizing
REDUCED
Ranking
#84 / 124
US stocks in progress
Trade P&L %
+8.64%
from signal to today
Rank position
ranks 84th among the 124 Longs already running for US stocks in our ranking, with a signal strength of 38 out of 100.
Sector context
SectorETF Broad
Benchmark ETF—
Sector regime
Performanceweekly coming soon · monthly coming soon
IWB belongs to the etf broad sector (reference ETF ).
restricted Platinum content