
IWV: technical analysis of week 16 under management
IWV bounces 1% on strong buy volume, but the MACD turns bearish
IWV: technical analysis of week 16 under management
Our view last week
IWV's weekly RSI keeps sliding, down to 59, with sellers still in charge of 75% of the volume: it's the fifth straight decline for CMF and momentum, the latter caving to 3.3 from 20.4 a month ago. IWV's technical analysis also points to the daily double bottom holding in the 414 area, with a 4% intermediate rebound. The trade, open for 15 weeks, still shows an 8.78% gain.
This week's summary
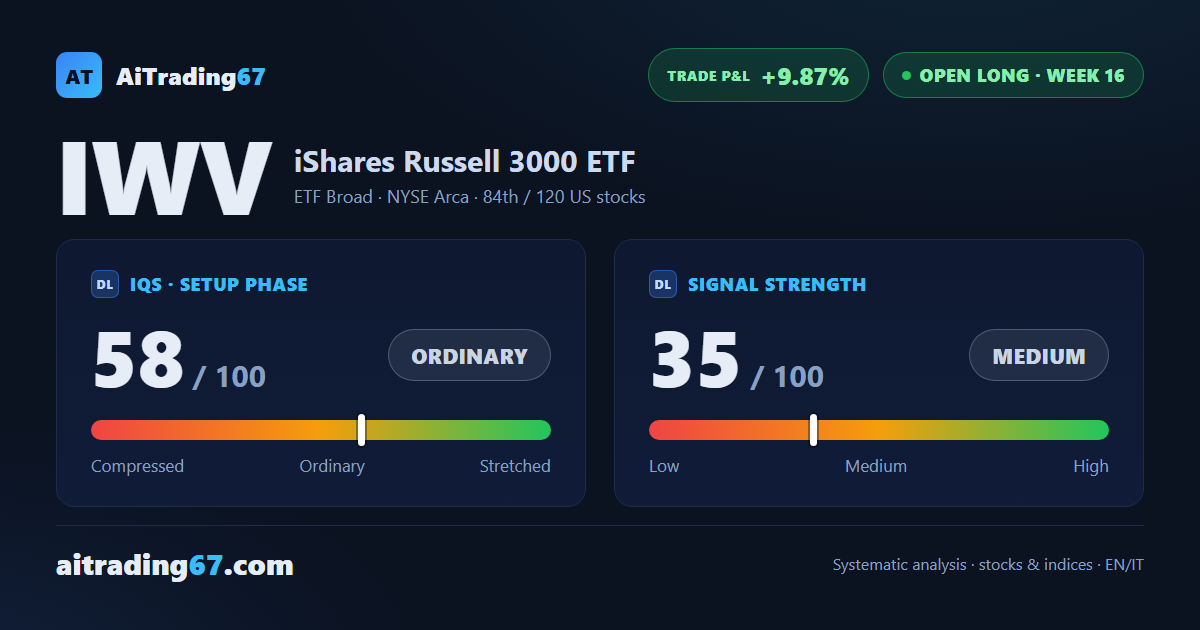
IWV, the US broad market ETF tracking the Russell 3000, closed the week with a 1% bounce and 91% of volume on the buy side, after two weeks of dominant selling. Beneath the surface the picture stays more cautious: the weekly MACD has turned bearish and money flow has declined for a sixth straight week. The buy signal is in its 16th week of management, with the trade up 9.87%.
IQS Phase
58
ordinary
Signal Strength
35
medium · weak
Sizing
REDUCED
Ranking
#84 / 120
US stocks in progress
Trade P&L %
+9.87%
from signal to date, no stop loss
Rank position
ranks 84th among the 120 Longs already running for US stocks in our ranking, with a signal strength of 35 out of 100.
Sector context
SectorETF Broad
Benchmark ETF—
Sector regime
Performanceweekly coming soon · monthly coming soon
IWV belongs to the etf broad sector (reference ETF ).
restricted Platinum content