
Japan ETF · buy signal in week 7
BBJP adds 0.9% and prints a new all-time high the weekly close fails to confirm
Our view last week
BBJP, the JPMorgan ETF on Japanese equities, bounced off its daily 20-day average and closed the week up 0.9%, after giving back 1.6% the week before. Price sits 1% below its all-time high, a ceiling tested 6 times in 10 weeks. This BBJP technical analysis still shows one of the weekly buy signals holding up as a swing trading setup, with signal strength slipping and weekly volumes contracting: the price action shows resilience, the momentum has yet to come back.
This week's summary
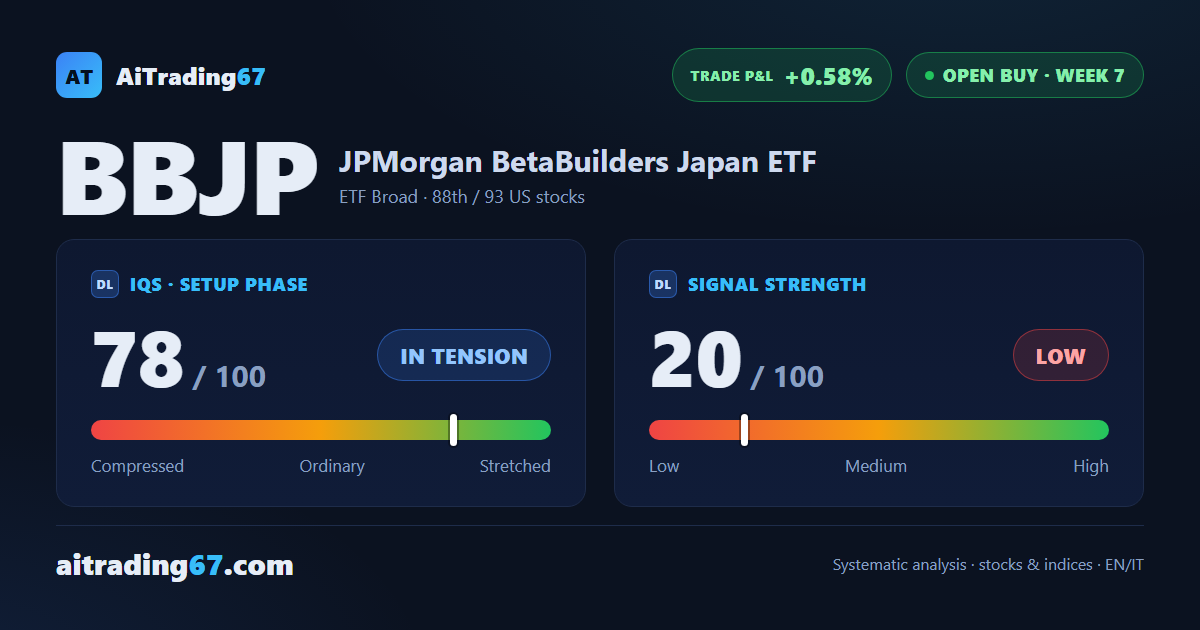
BBJP, the JPMorgan ETF on Japanese equities, is back in the 80 area and has printed a new all-time high, yet the week closed up 0.9% without clearing the old ceiling. A week ago price was lifting off its 20-day average; now the test sits right overhead, the 7th run at the highs in 10 weeks. This BBJP technical analysis still has one of the weekly buy signals standing as a swing trading setup, with volumes contracting and indecisive price action: the push is fading right where it is needed.
IQS Phase
78
in tension
Signal Strength
20
low · fading
Sizing
MINIMUM
Ranking
#88 / 93
US stocks in progress
Trade P&L %
+0.58%
from signal to date, no stop loss
Japan (BBJP) weekly chart — EMA50 · MACD · VWAP
Weekly chart · EMA50 · MACD · VWAP · Source: TradingView
Rank position
ranks 88th among the 93 Longs already running for US stocks in our ranking, with a signal strength of 20 out of 100.
Sector context
SectorETF Broad
Benchmark ETF—
Sector regime
Performanceweekly coming soon · monthly coming soon
BBJP belongs to the etf broad sector (reference ETF ).
restricted Platinum content