
JD.com: the decline eases after two rebound weeks
JD.com climbs 5.9% for a second week, and the Sell signal loses steam
JD.com: the decline eases after two rebound weeks
Our view last week
JD.com is in week 6 of a sell signal, and the week that just closed gained 4.8% after the prior week's -7.9%. Buying volume swung back to dominant at 96%, but still sits inside a sequence of 4 lower highs on the daily chart. Anyone holding a short position carries a 7.67% gain since entry.
This week's summary
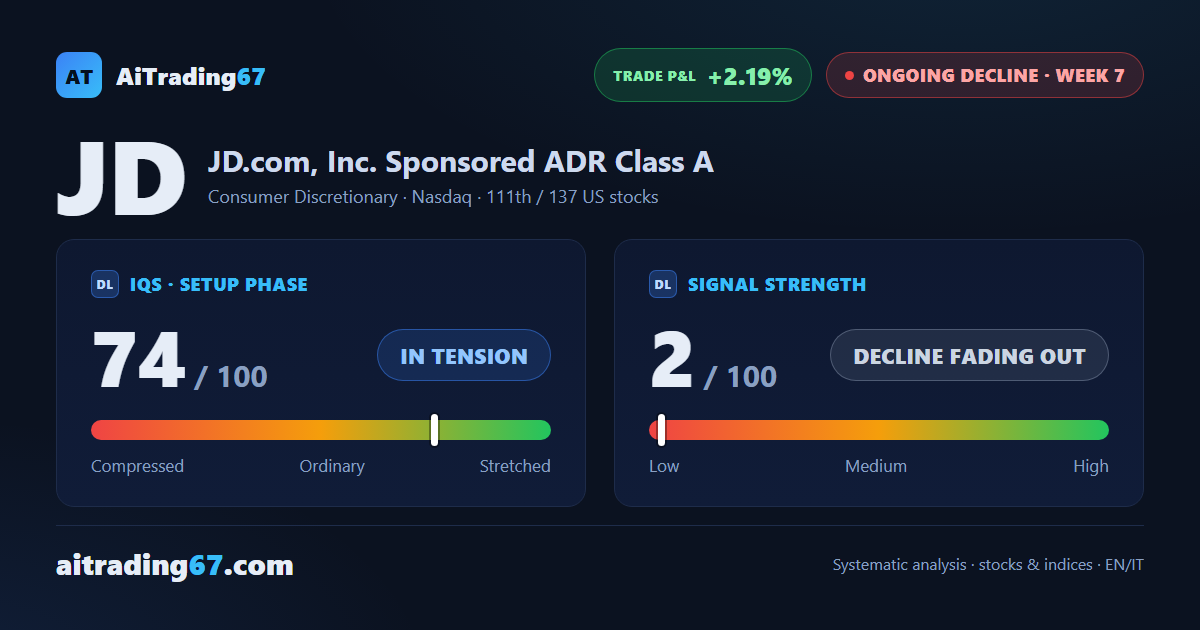
JD.com has closed a second straight up week — 5.9% after 4.8% — and the Sell signal, now in its 7th week, is starting to wobble: the short following it has seen its gain shrink to 2.19% from 7.67% a week ago. Price is boxed between support in the 27.3 area and resistance in the 28.3 area, with the RSI back in neutral territory. For anyone tracking JD.com stock with weekly technical analysis, it's a decline on stand-by worth watching.
IQS Phase
74
in tension
Signal Strength
2
decline fading out
Sizing
MINIMUM
Ranking
#111 / 137
US stocks
Trade P&L %
+2.19%
from signal to today
restricted Platinum content