
Johnson & Johnson, week 5: signal strength keeps fading
Johnson & Johnson slips 1.5% as the buy signal loses more ground
Johnson & Johnson, week 5: signal strength keeps fading
Our view last week
Johnson & Johnson's stock slips 2.3% this week, with sellers back in control right near its recent highs — a signal this weekly technical analysis reads as early fatigue in the buy setup, with strength down to 27 out of 100. Earnings land on July 15, and volatility could pick up. The trade, now in its 4th week, is still up 6.69% since entry.
This week's summary
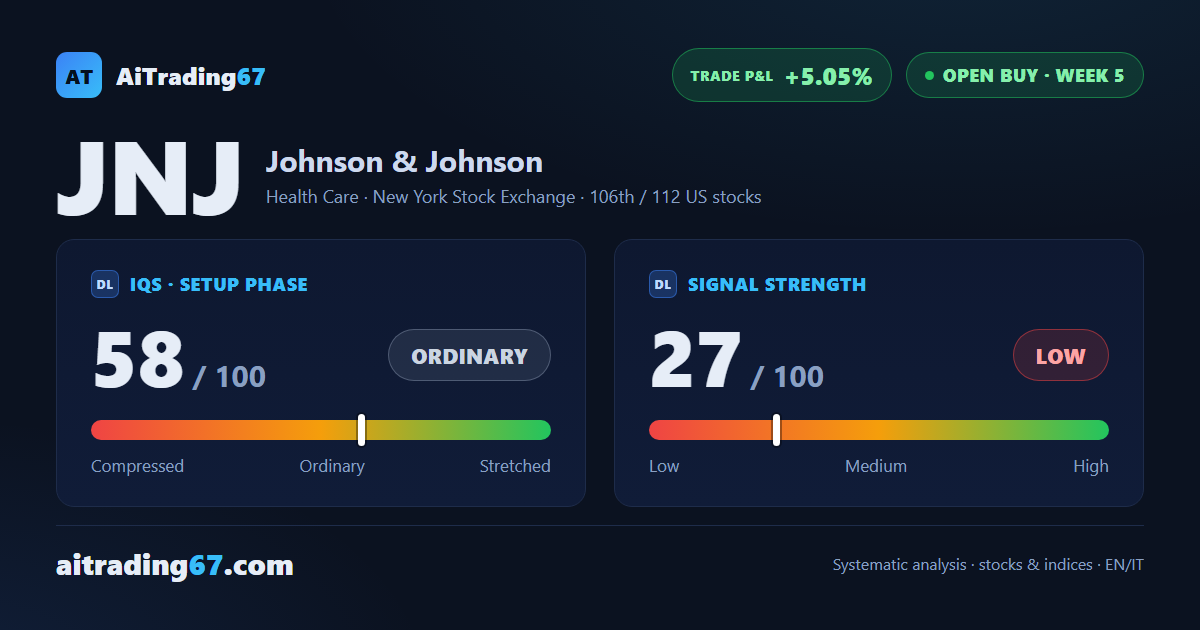
Johnson & Johnson's stock slips 1.5% this week, a lighter step than last week's -2.3%, but the weekly technical analysis tells the same story: buy signal strength holds flat at 27 out of 100, with sellers still in control of daily volume. Price is boxed between two short-term averages, while earnings from July 15 are now behind it. The trade, in its 5th week, is down to a 5.05% gain since entry, from 6.69% last week.
IQS Phase
58
ordinary
Signal Strength
27
low · fading
Sizing
MINIMUM
Ranking
#106 / 112
US stocks in progress
Trade P&L %
+5.05%
from signal to today
restricted Platinum content