
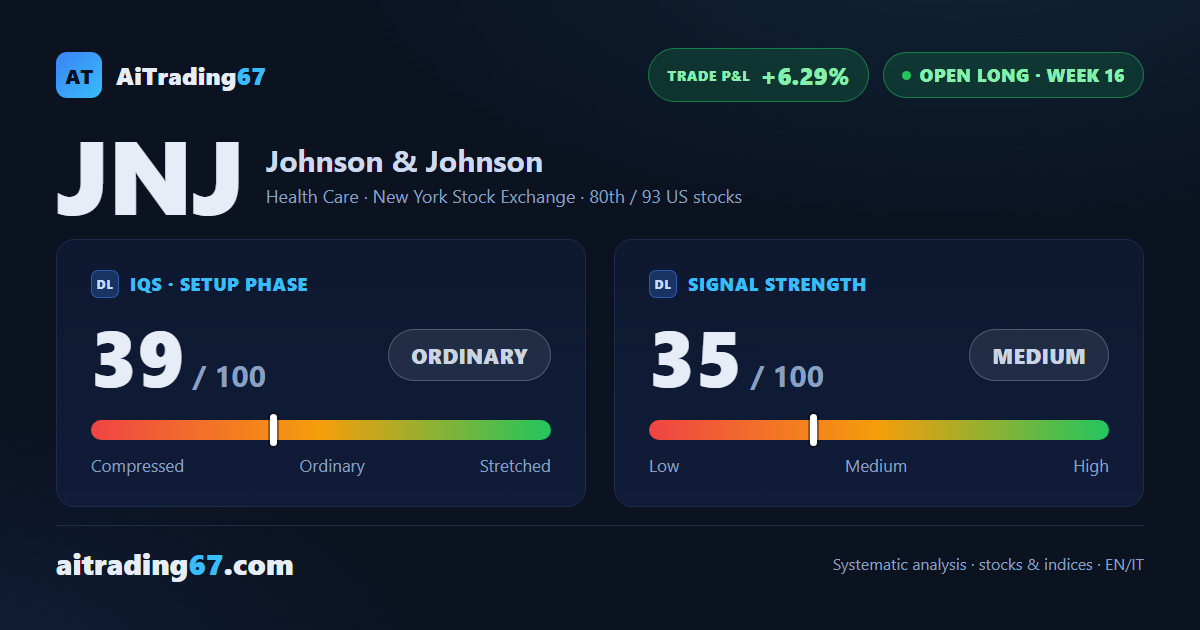
Open long, week 16
Johnson & Johnson drops 5.6% as the weekly MACD crosses bearish after 13 weeks
Our view last week
For a second straight week money is buying Johnson & Johnson stock: shares rise 0.5% with 61% of volume on the buy side, down from 81% seven days ago, and the CMF keeps climbing. ADX has risen for 10 weeks, while the MACD histogram shrinks for a third week and weekly price action stays indecisive. Technical analysis puts the price between the 7-day high, in the 275 area, and first support in the 271 area; the trade is 12.6% up from entry.
This week's summary
Johnson & Johnson stock falls 5.6% to a fresh 30-day low: our technical analysis shows the weekly MACD slipping below its Signal line after 13 weeks and money flow turning negative again. Price closed below the first stop level (SL1) and the second stop level (SL2) flagged in last week's card (258.86 area, 258.17 area): for anyone following those levels the trade is closed. The close and the Inversion Point, in the 259 area, have already crossed with no change of sign declared: one to watch in the coming sessions.
IQS Phase
39
ordinary
Signal Strength
35
medium · weak
Sizing
REDUCED
Ranking
#80 / 93
US stocks in progress
Trade P&L %
+6.29%
from signal to date, no stop loss
Johnson & Johnson (JNJ) weekly chart — EMA50 · MACD · VWAP
Weekly chart · EMA50 · MACD · VWAP · Source: TradingView
Rank position
ranks 80th among the 93 Longs already running for US stocks in our ranking, with a signal strength of 35 out of 100.
Sector context
SectorHealth Care
Benchmark ETFXLV
Sector regimein positive regime
Performanceweekly -2.65% · monthly -3.91%
JNJ belongs to the health care sector (reference ETF XLV). The sector is classified in positive regime according to our weekly reading.
restricted Platinum content