
Kering, week 4: an 8% bounce, but the signal is fading
Kering ends flat (+0%): the double bottom near 240 bounces 8%
Kering, week 4: an 8% bounce, but the signal is fading
Our view last week
Kering is in the 3rd week of a buy signal, ranking 15th among the 62 Longs already running for European-UK stocks. The confirmation week closed bullish, but our model rates the setup as technically weak despite the price rising, and recommends a cautious lightening on part of the position. The trade is still down 7.42% since entry.
This week's summary
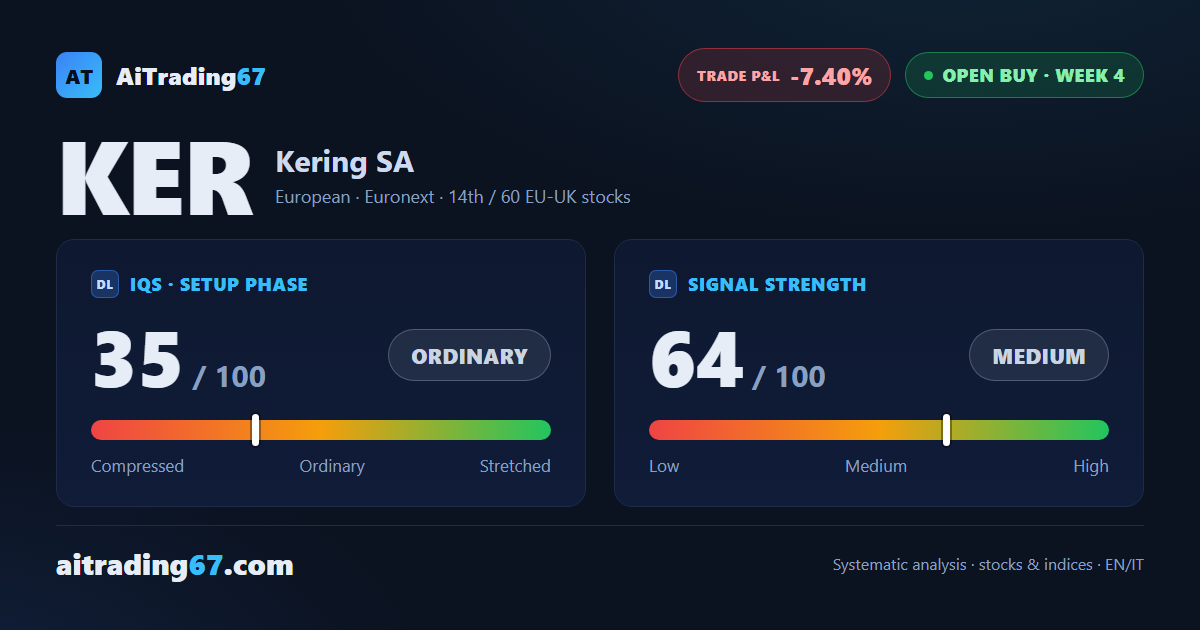
Kering weekly technical analysis: the stock closed the week unchanged (+0%), but underneath, price bounced 8% off a double bottom in the 240 area — a sign the level is holding, even with volume still contracted. The buy signal, now in its 4th week, is fading: strength drops to 64 out of 100, and the trade remains down 7.4%. Kering ranks 14th among the 60 European buys still open.
IQS Phase
35
ordinary
Signal Strength
64
medium
Sizing
STANDARD
Ranking
#14 / 60
EU-UK stocks in progress
Trade P&L %
-7.40%
from signal to today
restricted Platinum content