
Ninth week of management, decline stalls
Kinder Morgan sheds 4.1% as the Sell signal stays boxed between two technical walls
Ninth week of management, decline stalls
Our view last week
Kinder Morgan slips 2.1% on the week, but the latest session shows buyers at 86.9% of trading and weekly money flow at its highest level in four weeks. The daily chart forms a strong bullish engulfing bar, while the weekly picture stays bullish-leaning with two caution flags from the recent candles. The sell signal, now in its eighth week, remains unconfirmed by the market after three observation weeks that closed sideways.
This week's summary
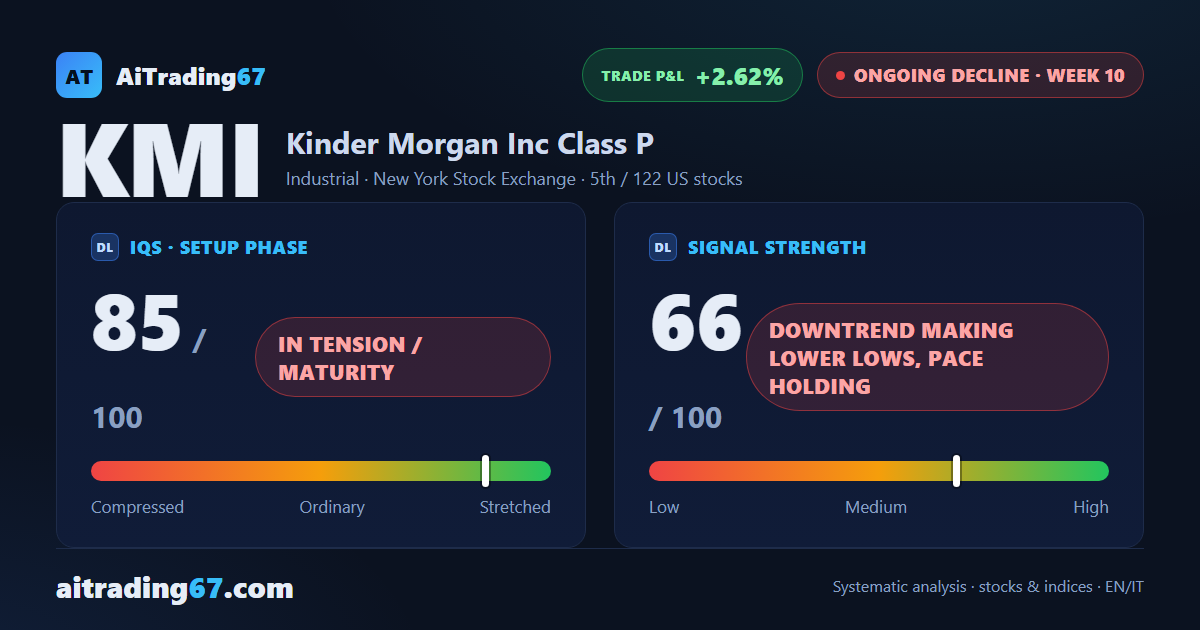
Kinder Morgan sheds 4.1% on the week, with 84% of trading on the sell side: the Sell signal, in its ninth week of management, stays boxed in a very tight range between the 200-day average and the 7-day low. Kinder Morgan's technical analysis shows a stalled picture, not yet breaking either way; the short still sits in profit, just above 2%.
IQS Phase
85
in tension / maturity
Signal Strength
66
downtrend making lower lows, pace holding
Sizing
STANDARD
Ranking
#5 / 122
US stocks
Trade P&L %
+2.62%
from signal to date, no stop loss
Rank position
ranks 5th among the 122 sell signals for US stocks in our ranking, with a signal strength of 66 out of 100.
Sector context
SectorIndustrial
Benchmark ETFXLI
Sector regimein strong phase
Performanceweekly +2.97% · monthly +2.64%
KMI belongs to the industrial sector (reference ETF XLI). The sector is classified in strong phase according to our weekly reading.
restricted Platinum content