EN IT

Eastman Kodak: technical bounce in the 9.1 area, but the decline isn't over

In week 4 of the sell signal, Eastman Kodak bounced 6.5% after the prior week's -8.7% drop. A double bottom in the 9.1 area is holding, but MACD and CMF point to a structurally ongoing decline.

Eastman Kodak: technical bounce in the 9.1 area, but the decline isn't over
Sell signal · Week 4 · US stocks
Eastman Kodak: technical bounce in the 9.1 area, but the decline isn't over
June 12, 2026
Sell signal · Week 4 · US stocks
In Summary
Eastman Kodak is in week 4 of a sell signal: after the prior week's 8.7% drop, this week saw a 6.5% bounce with buyers back at 62%. A double bottom in the 9.1 area is visible on the daily chart, but underlying indicators remain in bearish territory. Trading is not recommended, with the stock still 46% above its 200-week moving average.
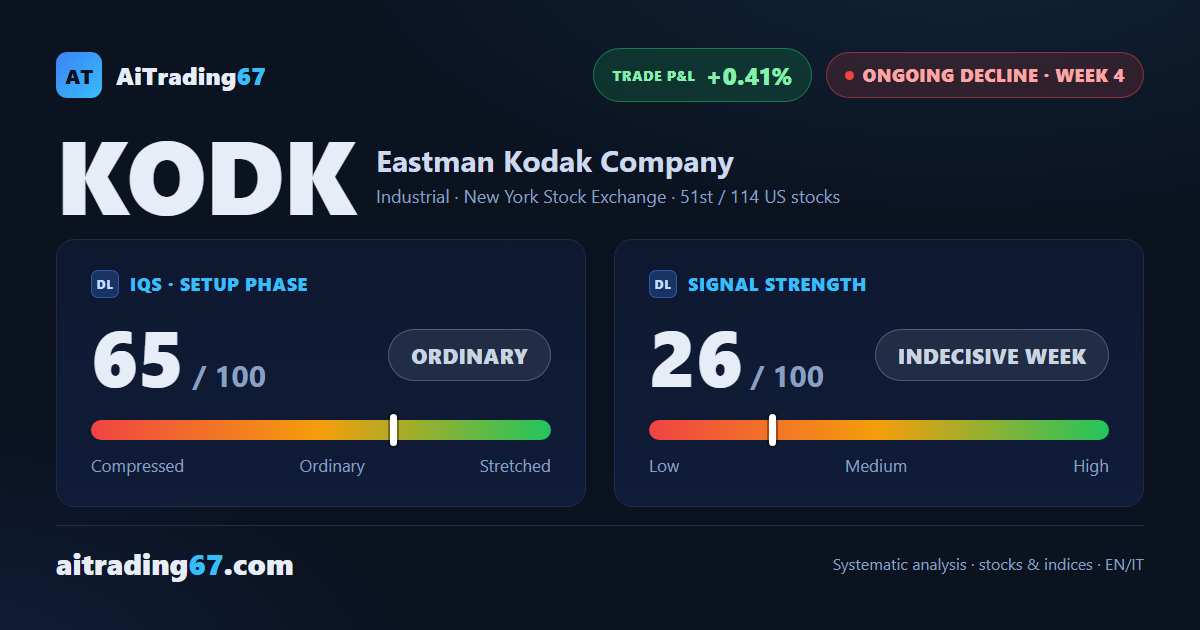
Ongoing decline ·4th week from start ·US stocks ·T2 ★ See Gold version →
IQS Phase
65
ordinary
Signal Strength
26
indecisive week
Sizing
MINIMUM
Ranking
#51 / 114
US stocks
Trade P&L %
+0.41%
from signal to today
Chart · Weekly — EMA50 · MACD · VWAP
Weekly chart · EMA50 · MACD · VWAP · Source: TradingView
How to read this pageA visual guide to the post, card by card
The full analysis, operating plan and detailed levels on this asset are reserved for clients ★ PLATINUM
restricted Platinum content
Share WhatsApp Telegram Gmail LinkedIn