
Kodak: calmer on the surface, money flow still fading
Kodak sheds 2.8% and loses its 9.1 floor, but money flow keeps fading
Kodak: calmer on the surface, money flow still fading
Our view last week
Week 8 of the sell signal on Eastman Kodak, and the week just closed down 11.5% with sell volume at 90%. The technical picture shows no sign of the pressure easing: the MACD histogram is worsening, CMF has swung back into distribution and momentum has turned more negative. In the background, a double bottom in the 9.1 area remains visible, its intermediate 12% bounce largely given back.
This week's summary
Last week Kodak's double bottom in the 9.1 area was still holding; this week that floor gave way, and the stock shed another 2.8%, on lighter sell volume (58% versus 90% two weeks ago). Underneath, though, money flow keeps sliding into deeper distribution, and the weekly RSI has dropped below 50. Price now swings between the floor in the 7.96 area and resistance in the 8.26 area.
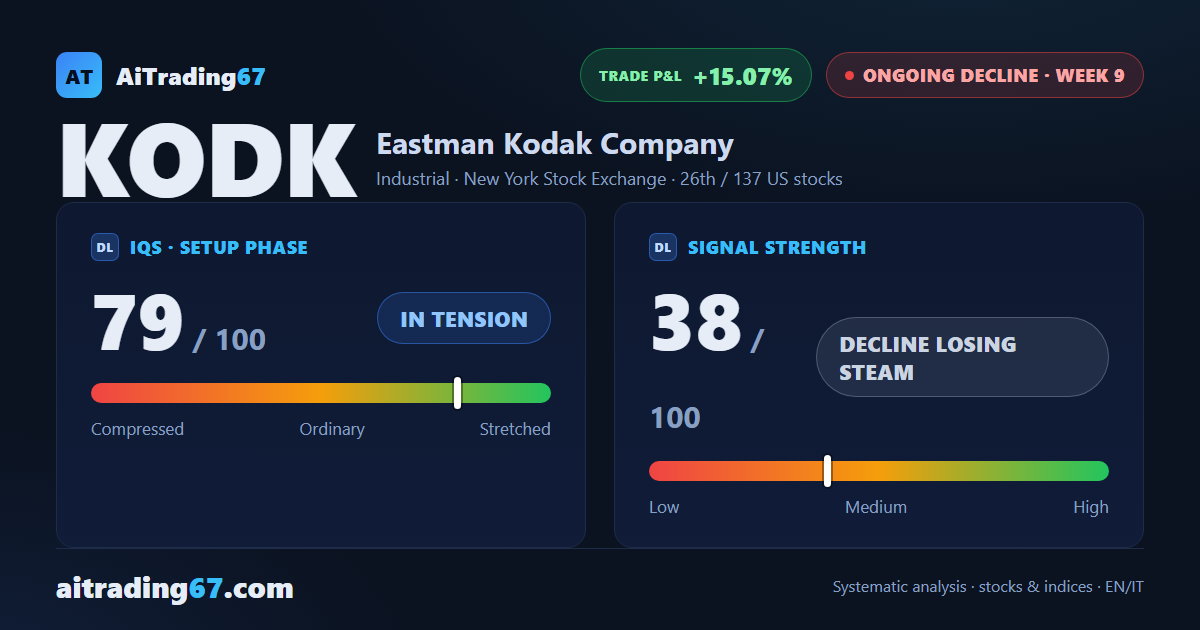
IQS Phase
79
in tension
Signal Strength
38
decline losing steam
Sizing
REDUCED
Ranking
#26 / 137
US stocks
Trade P&L %
+15.07%
from signal to today
restricted Platinum content